| Business Cycles |
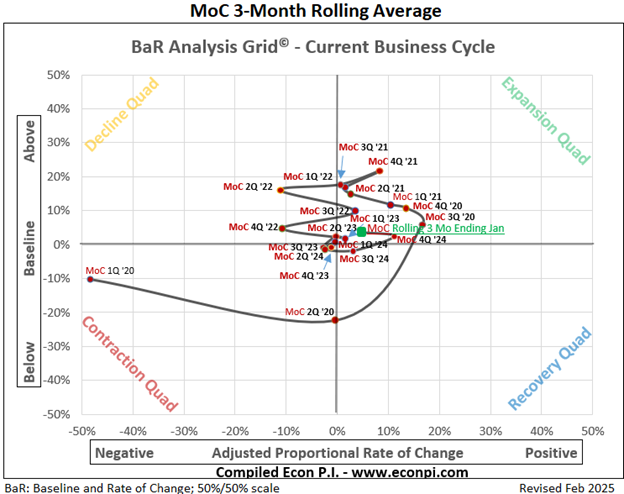
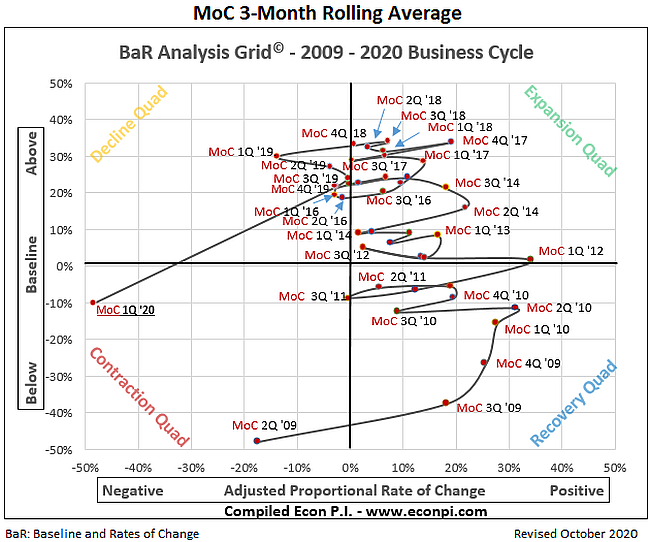
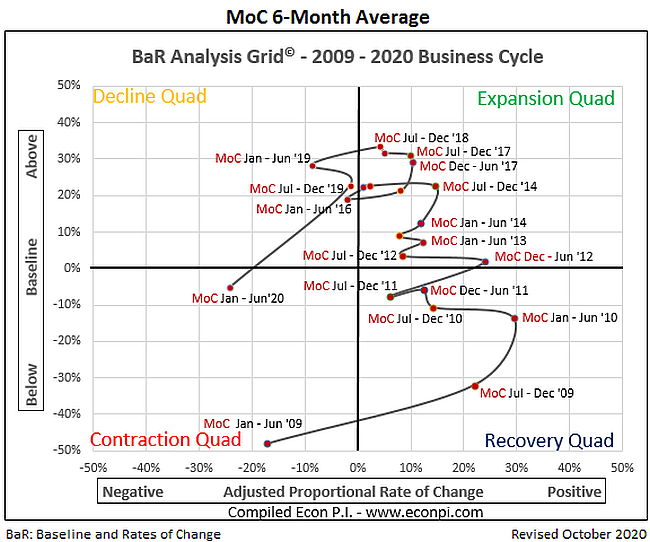
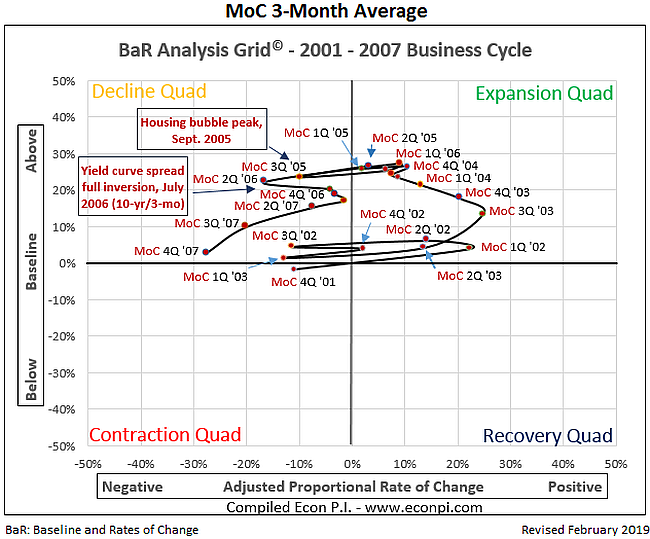
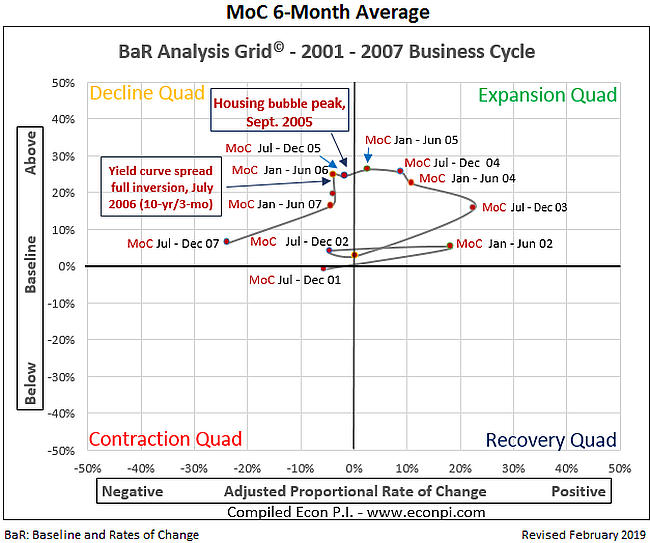
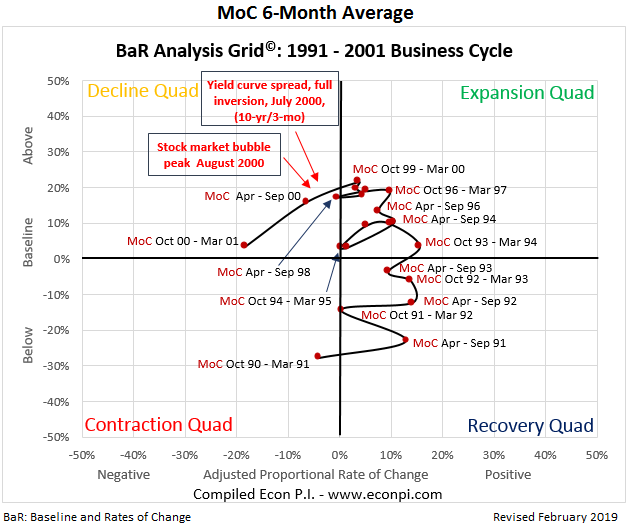
Using the mean of coordinates (MoC), the 1991 - 2001, 2001 - 2007, 2008 - 2020, and current business cycles have been plotted. Business cycles are officially determined by the National Bureau of Economic Research. Because there are limited economic measures for the 1991 - 2001 business cycle, only six-month MoC averages are shown. The MoC is the average of all the economic indicators for a particular period. The MoC signals the general health of the economy. (Note: The "full" yield curve inversion event shown on the 1991 - 2001 and 2001 - 2007 grids is when the inversion continued for 30 days or more.) The most recent BaR Analysis Grid© can also be seen on the home page. (Thanks to Jim Cuppy for suggesting that the business cycle be displayed in this manner.) |


|
![]()
Quick, unbiased view of the economy...
"Insensibly one begins to twist facts to suit theories, instead of theories to suit facts." — Sherlock Holmes, A Scandal in Bohemia