Weekly economic update
| Current Economic Conditions | |||||||||||||||||||||||||||||
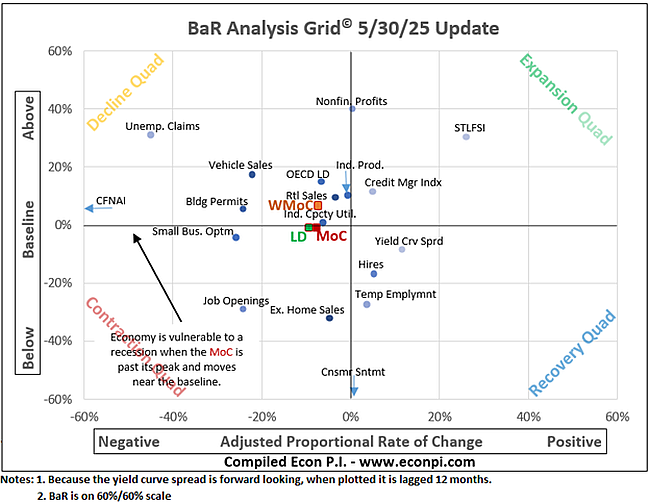
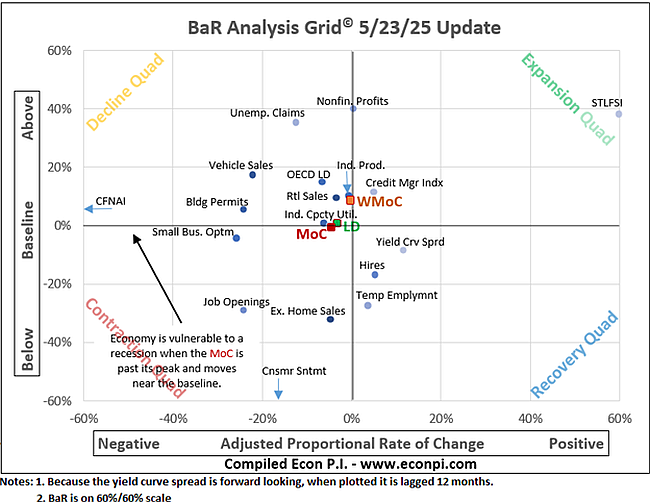
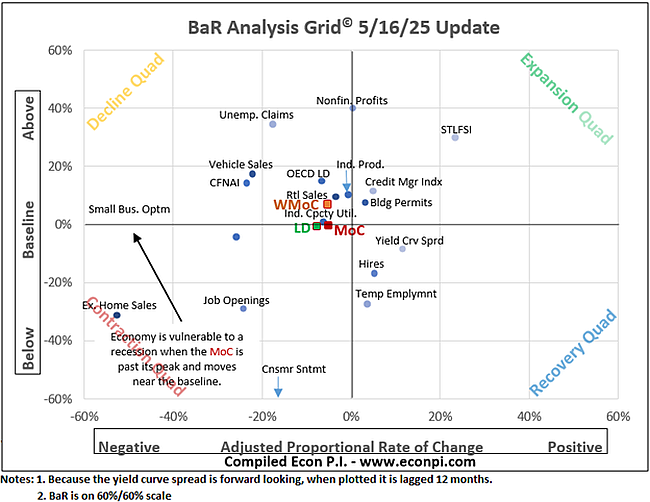
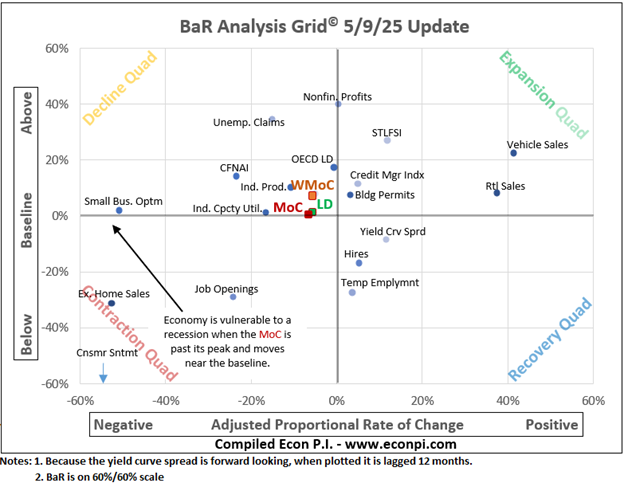
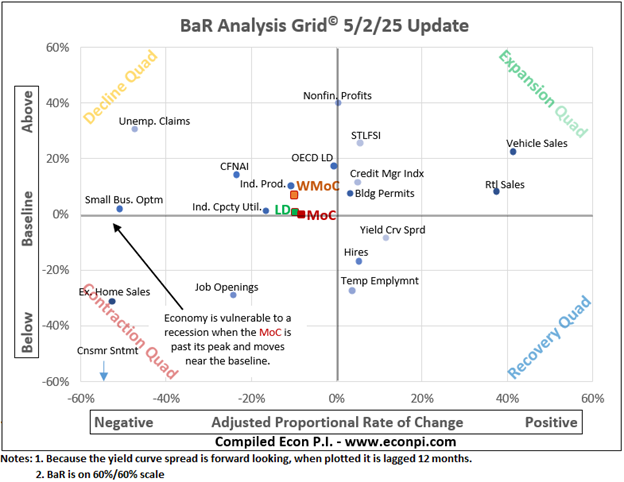
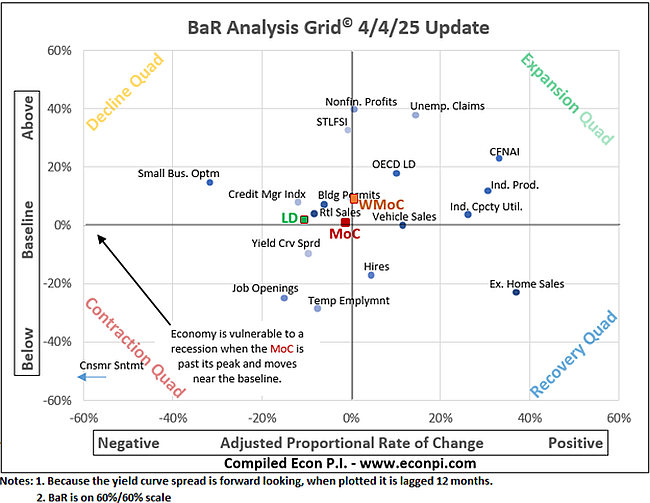
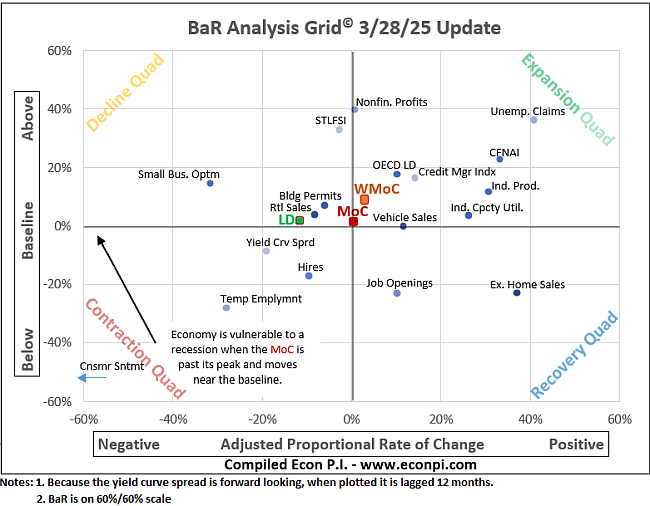
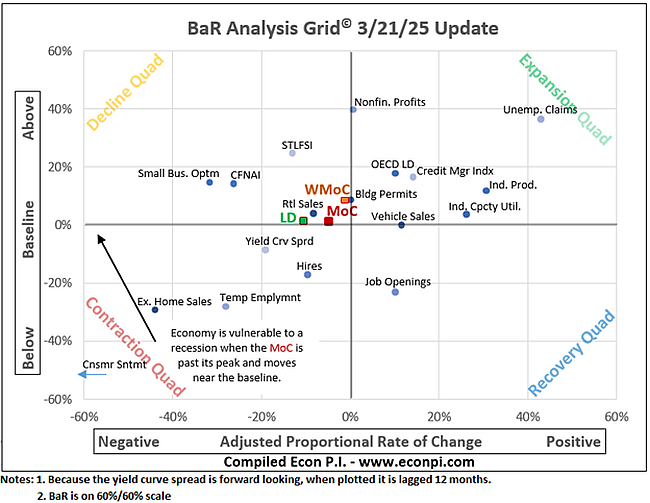
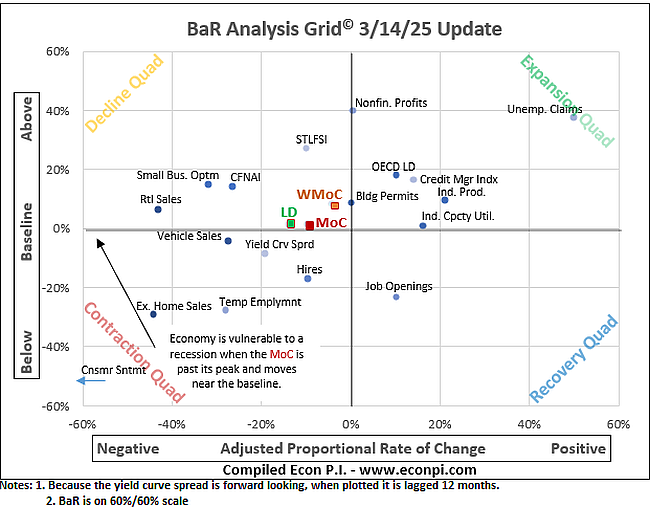
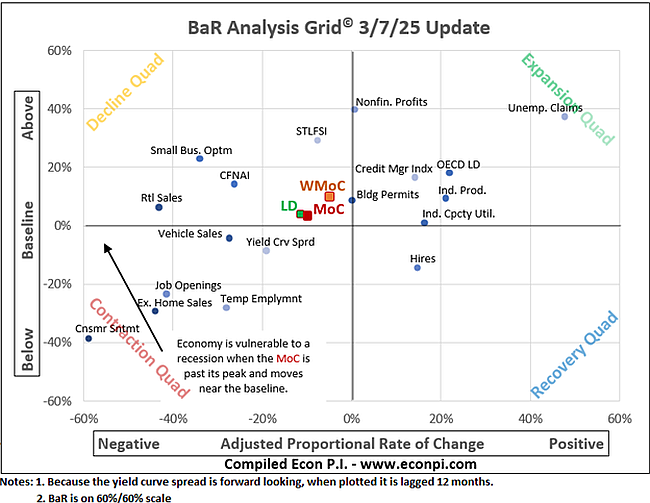
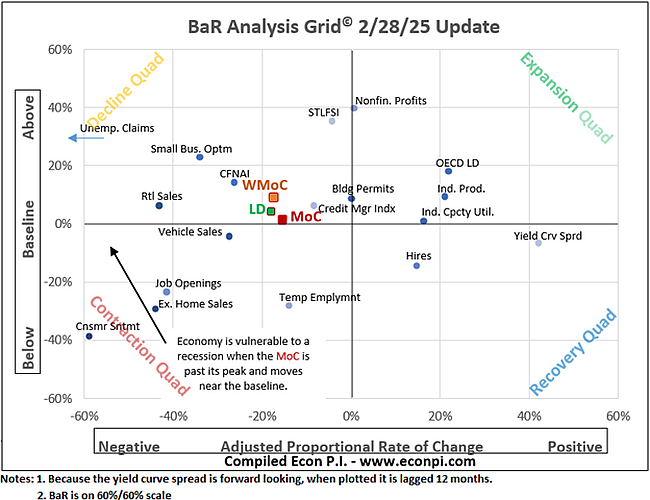
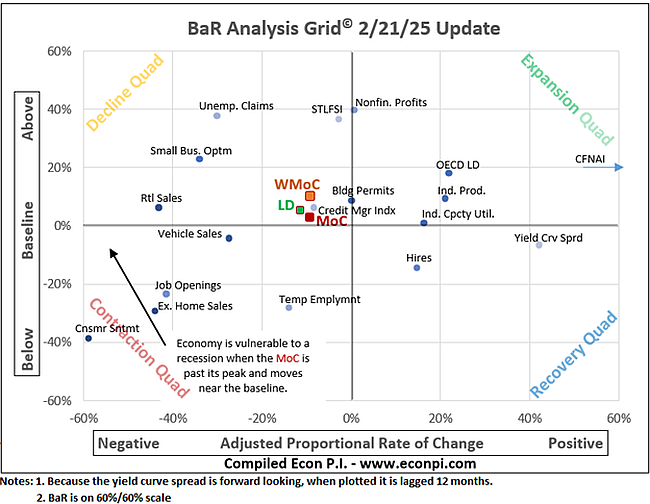
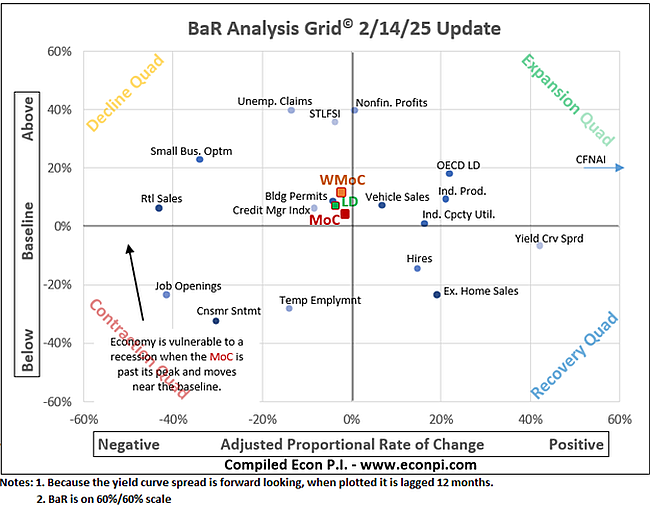
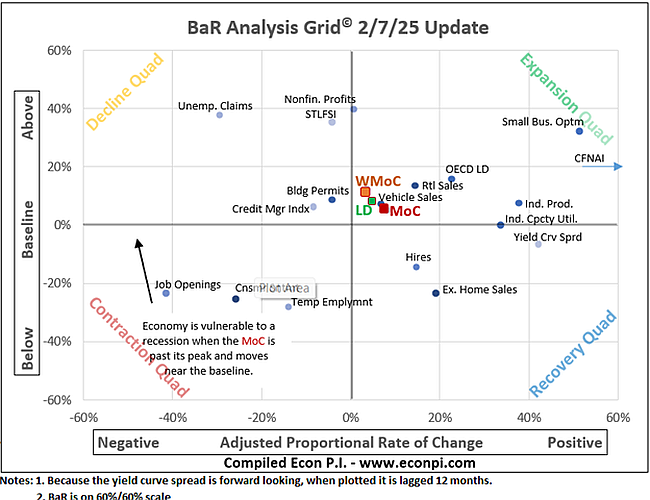
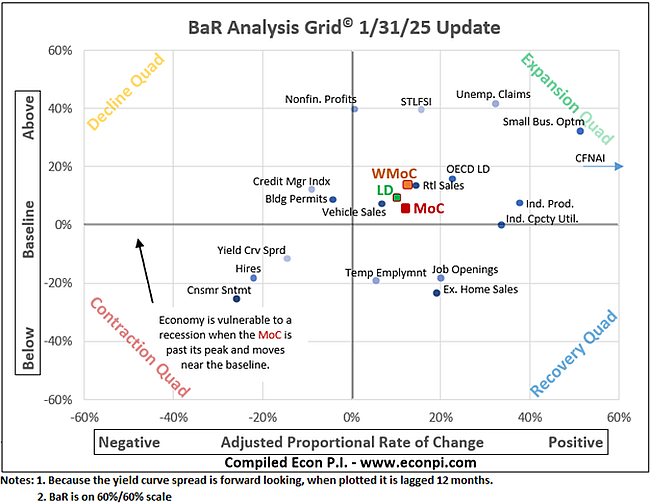
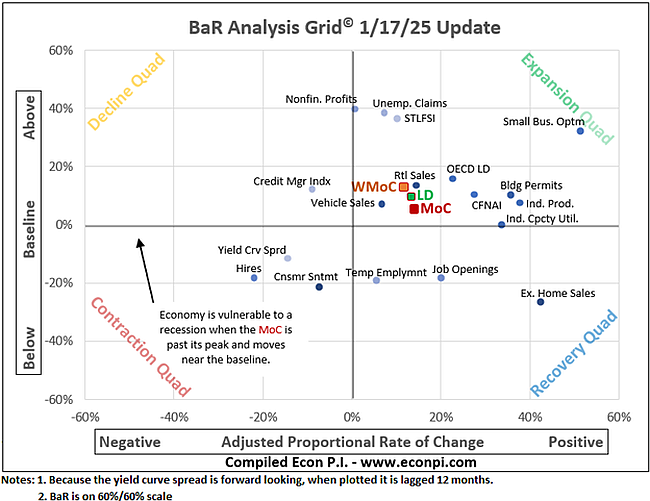
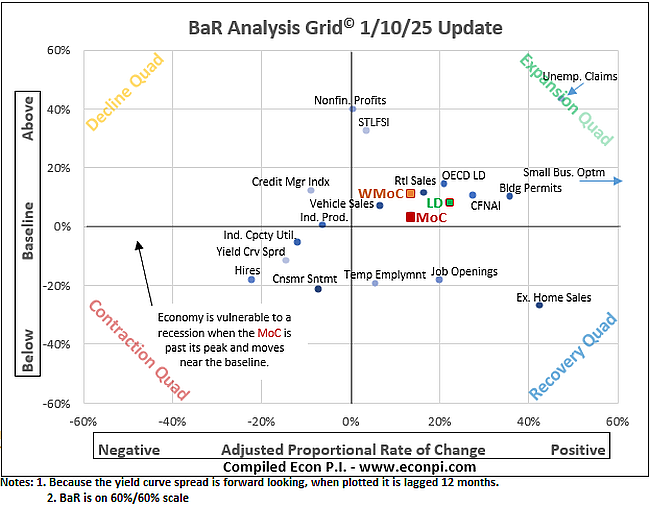
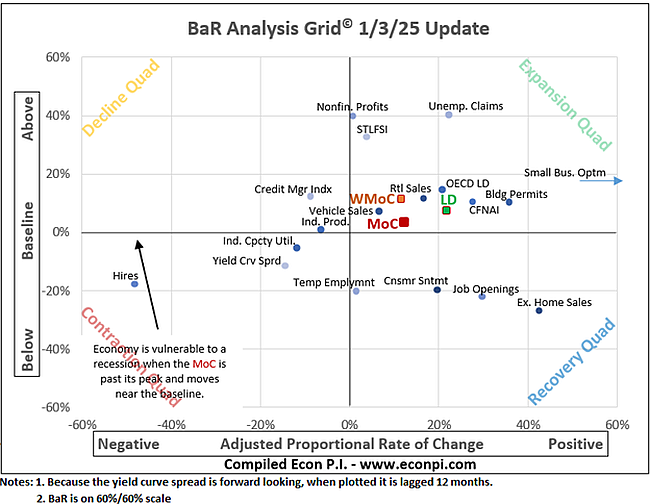
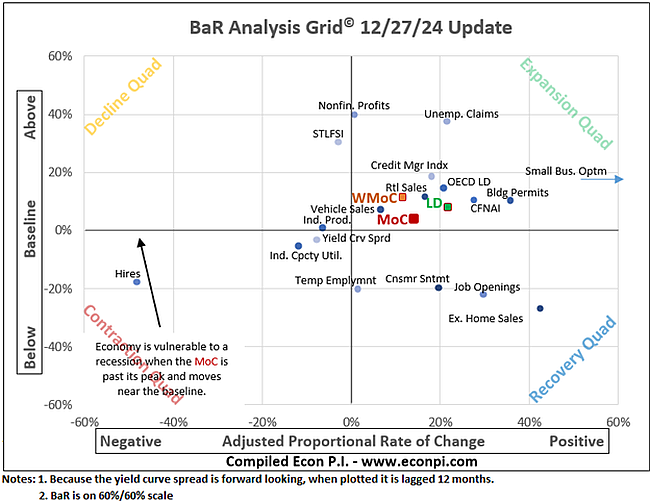
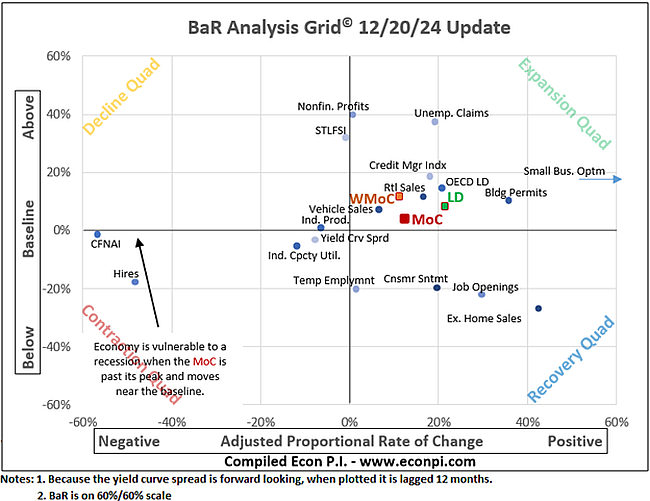
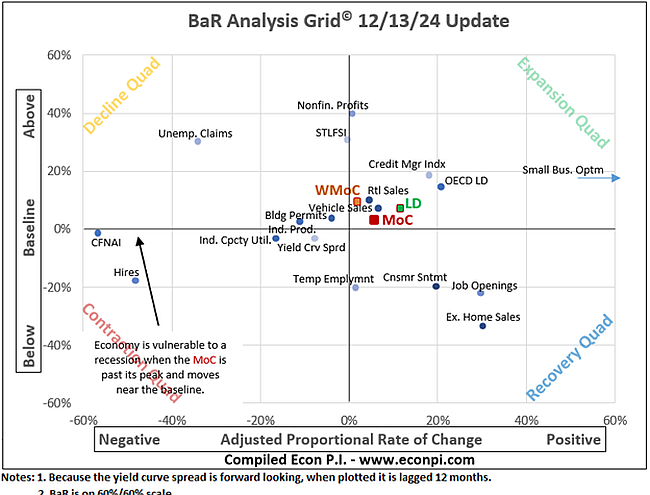
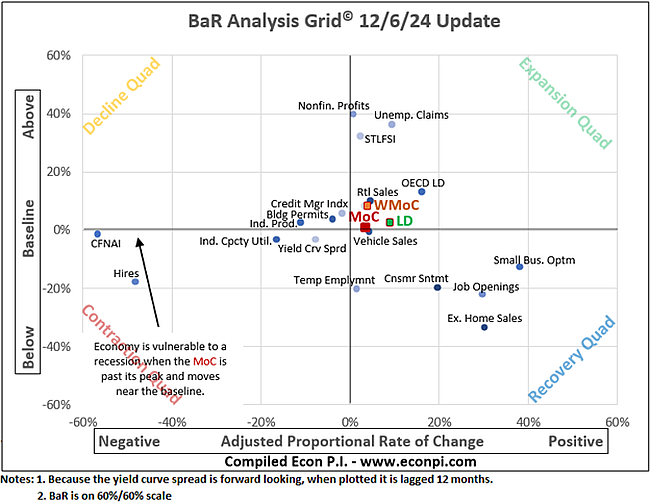
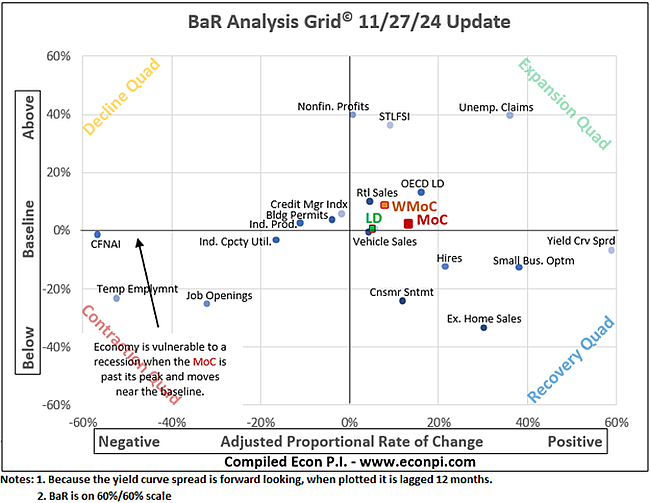
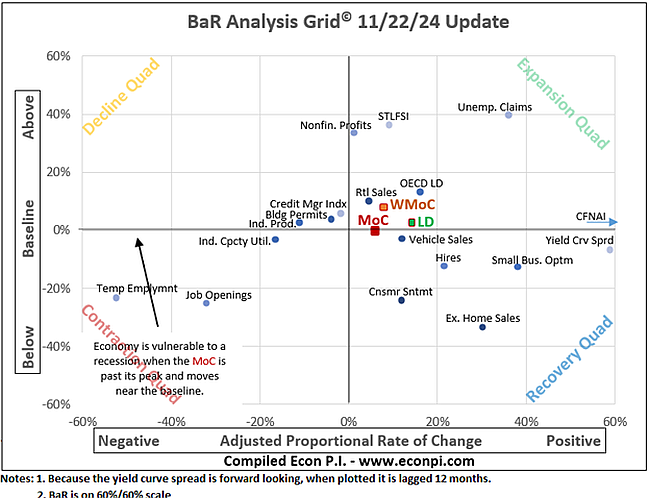
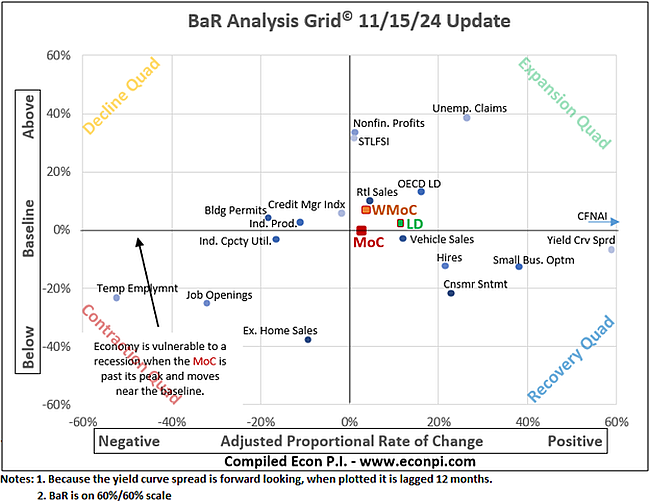
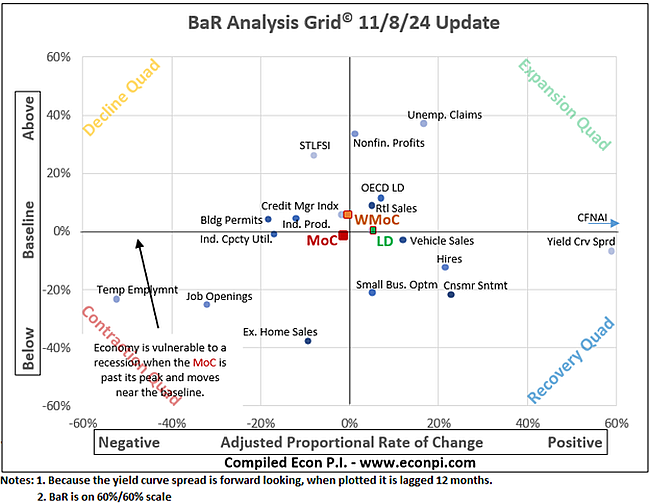
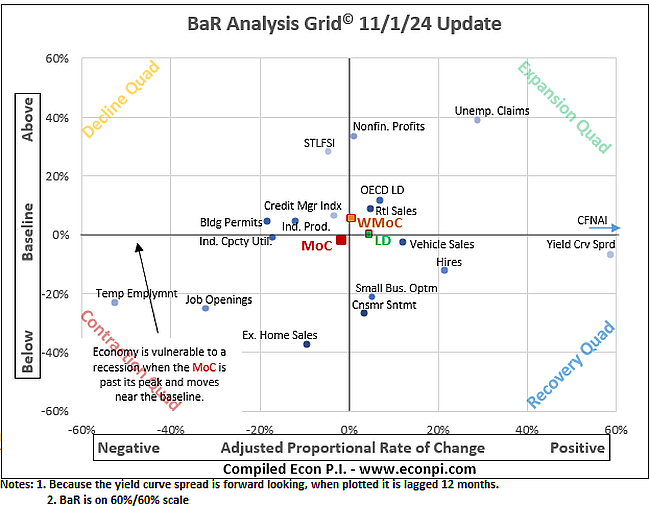
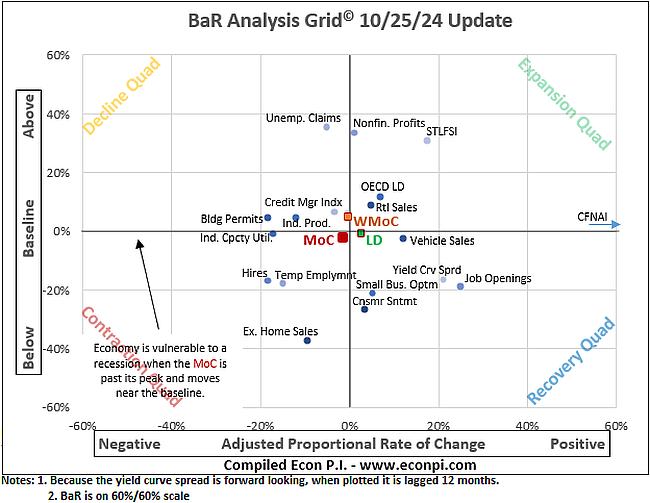
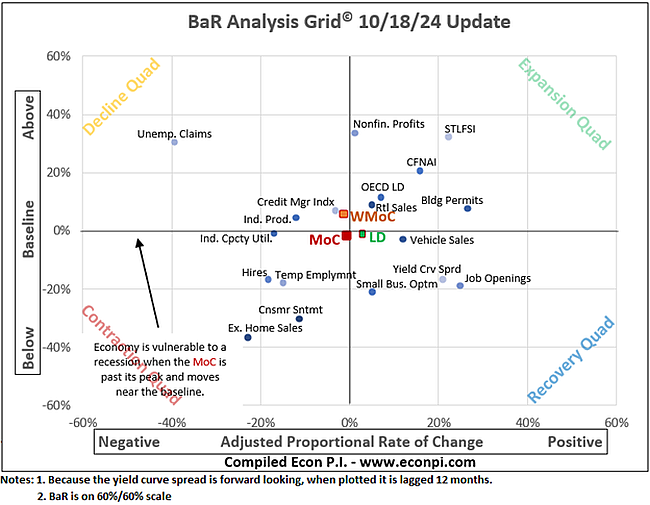
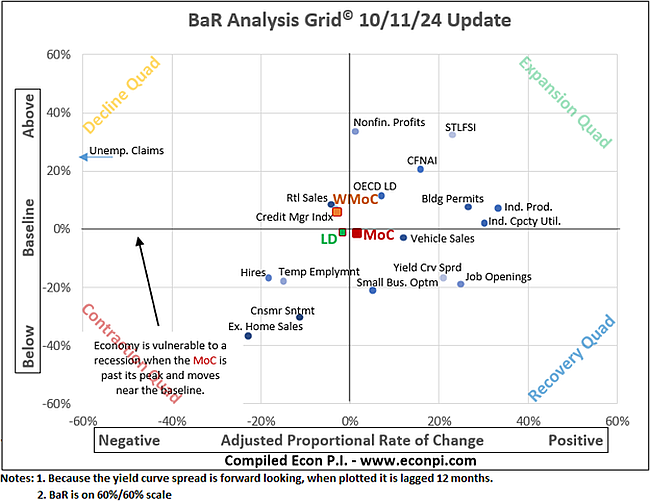
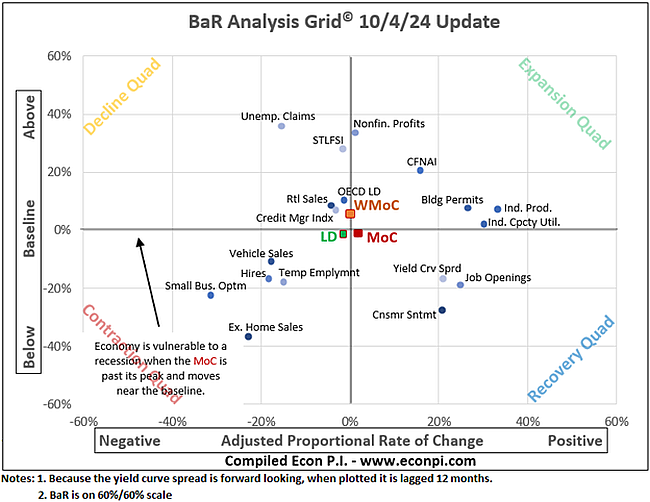
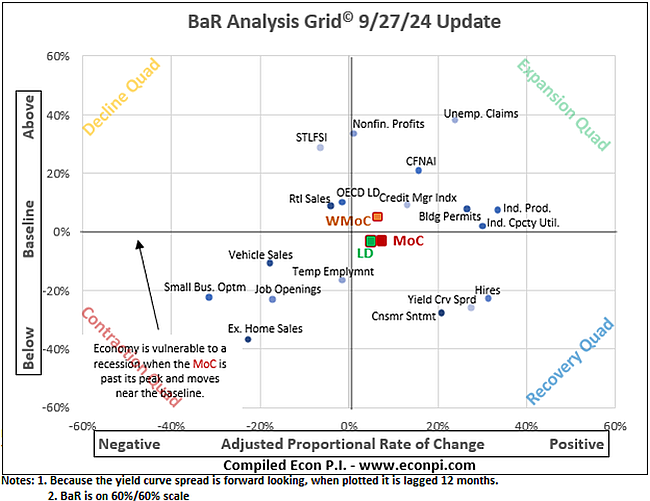
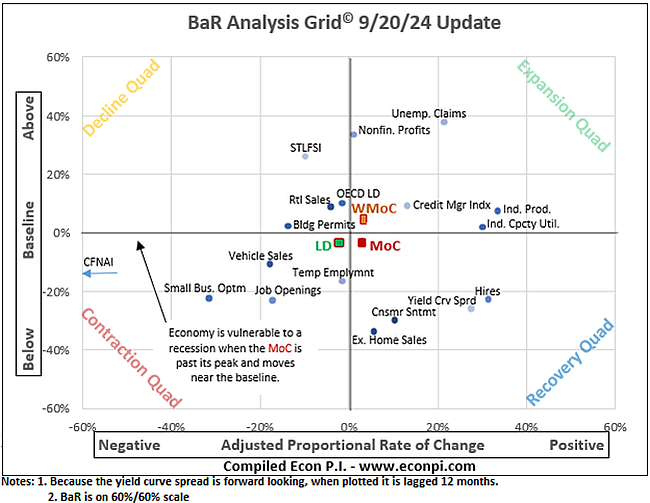
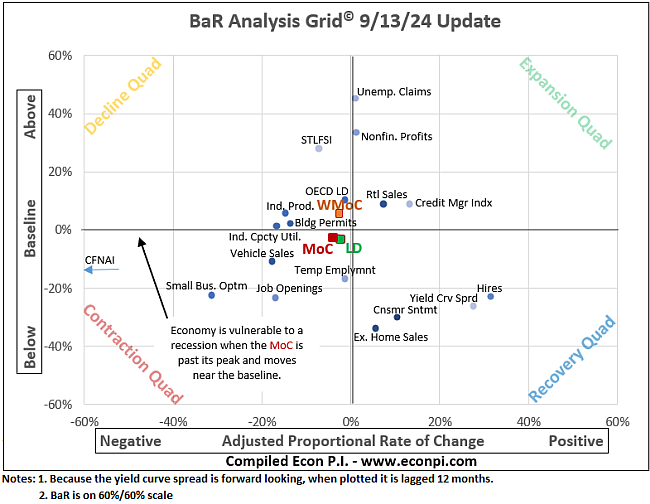
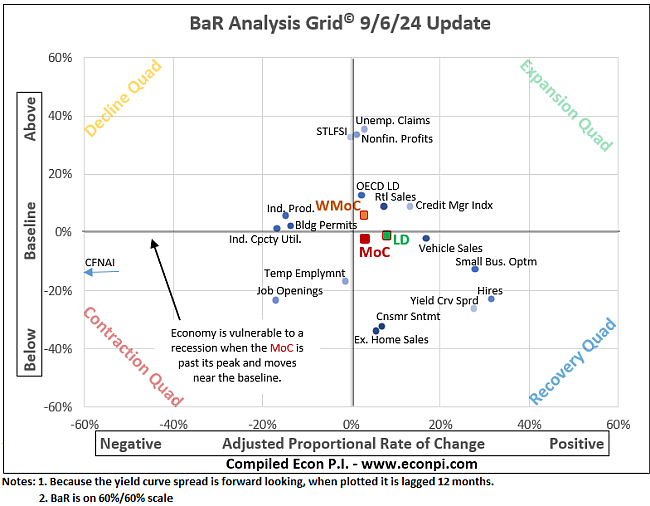
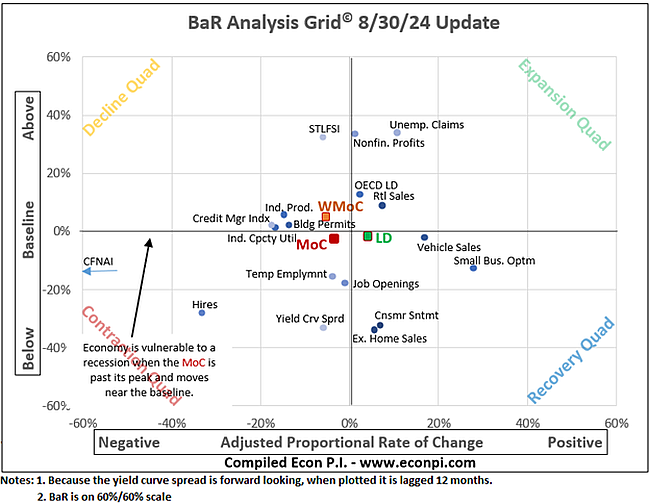
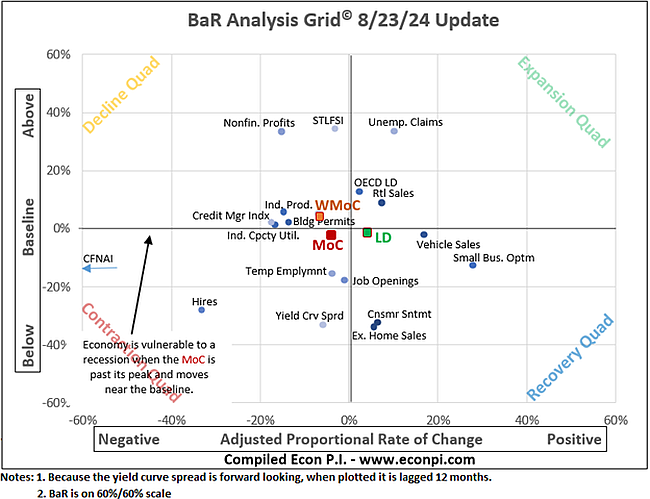
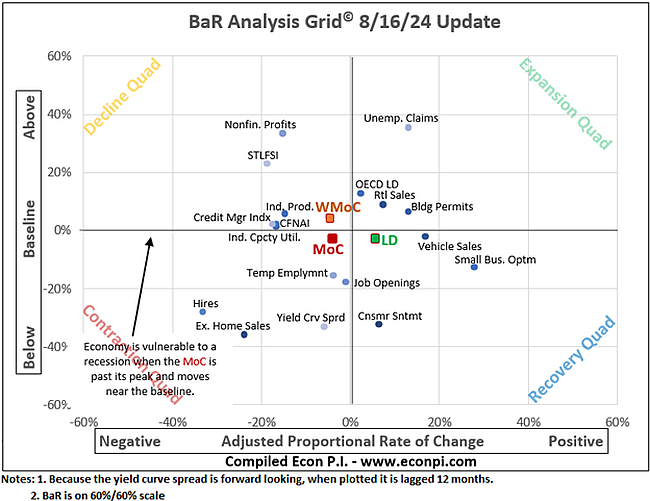
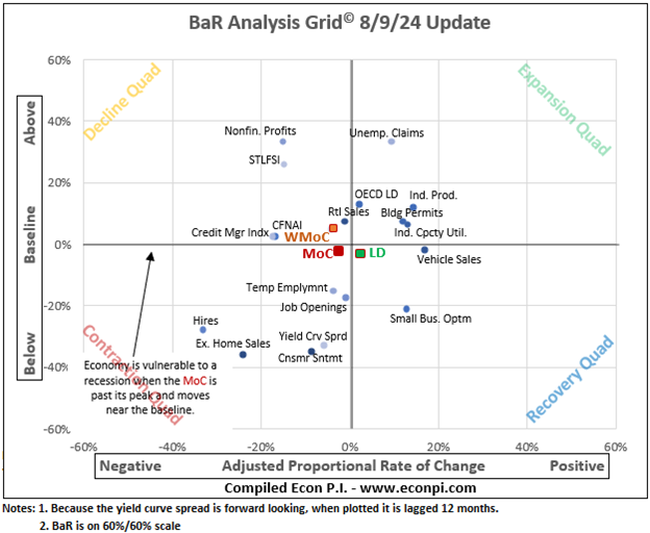
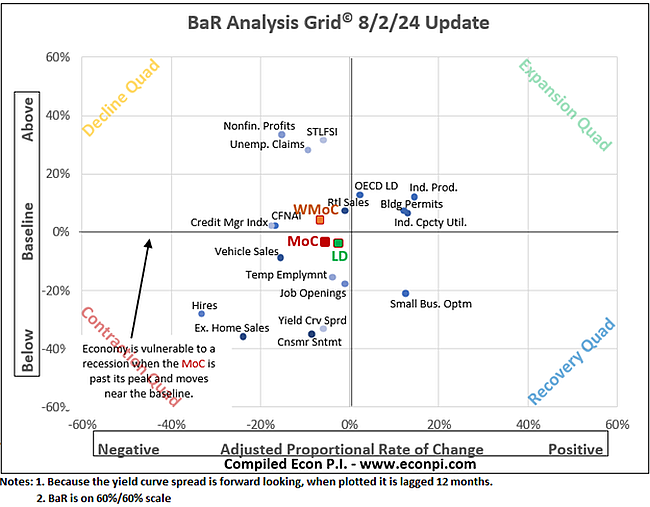
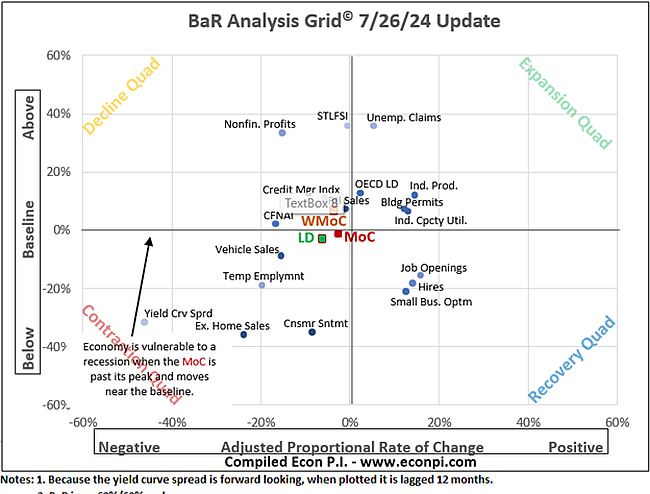
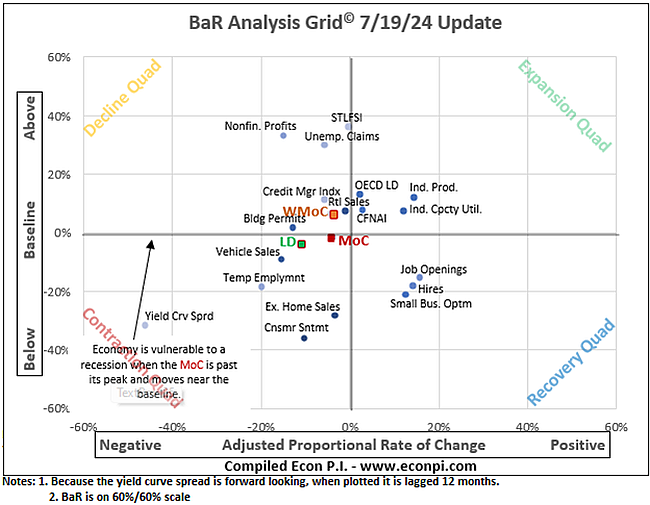
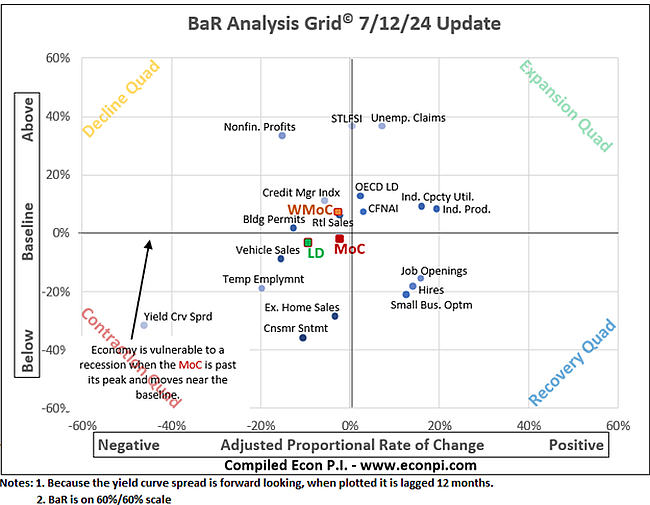
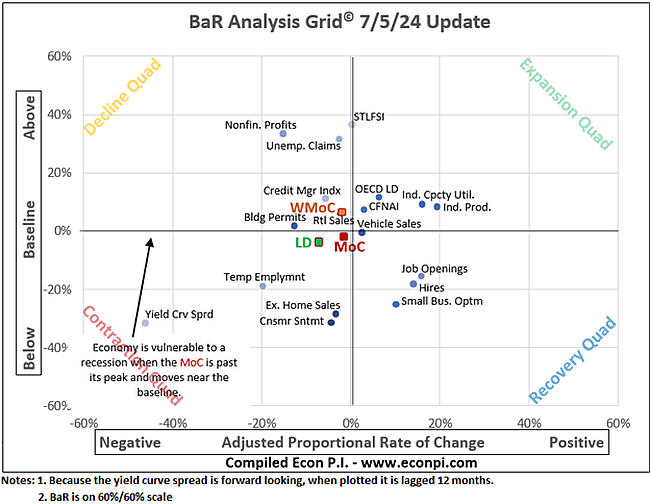
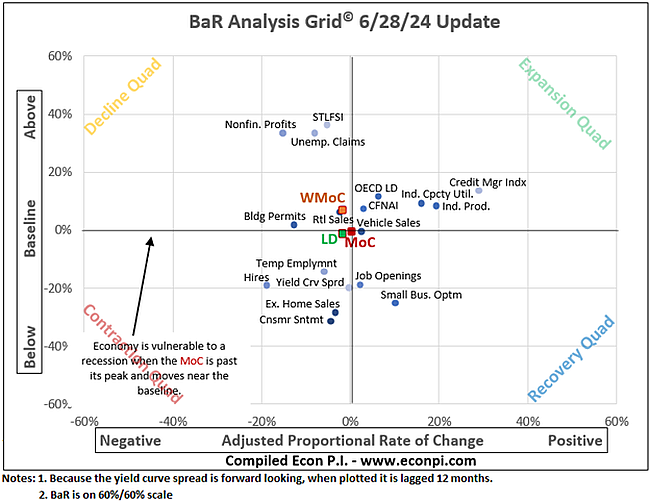
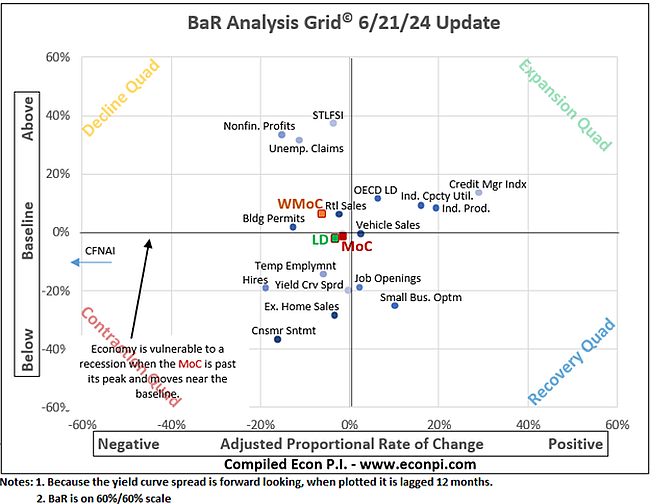
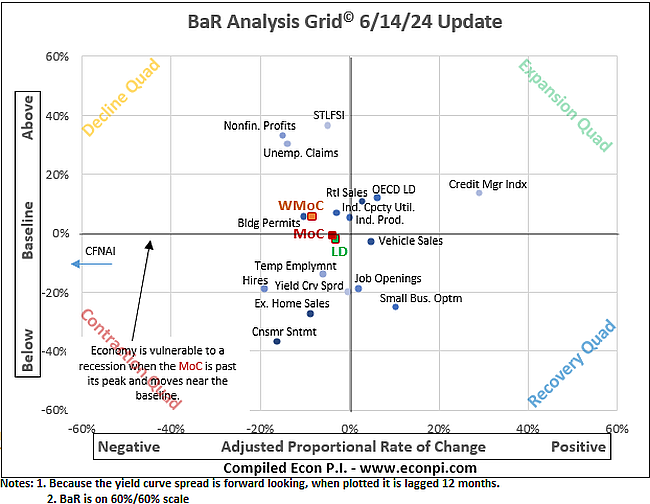
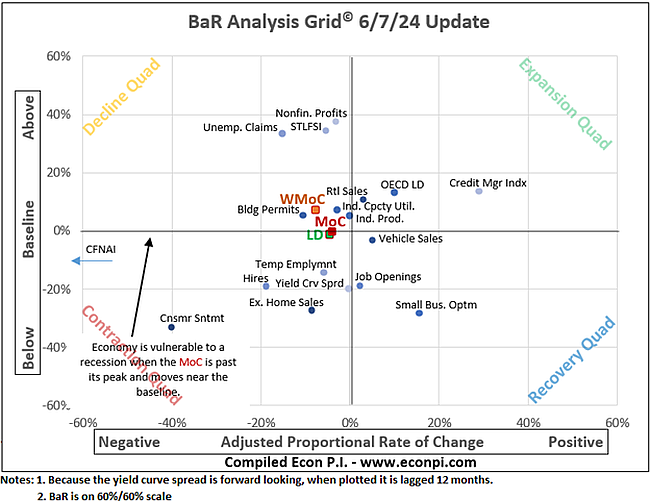
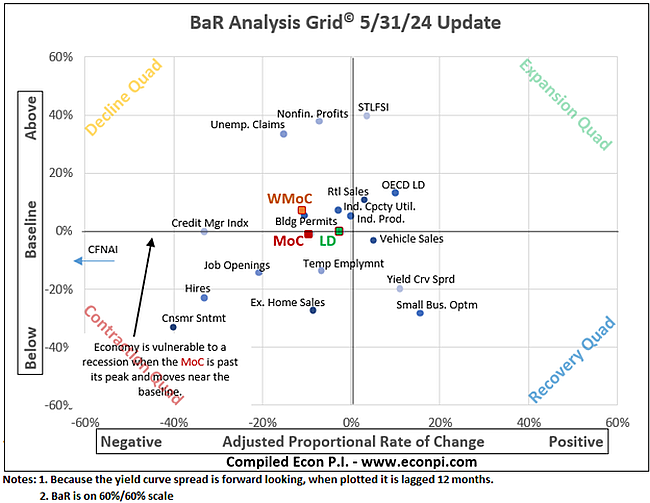
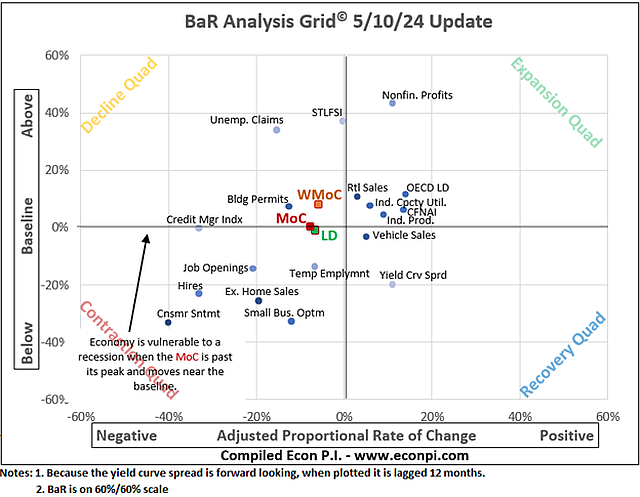
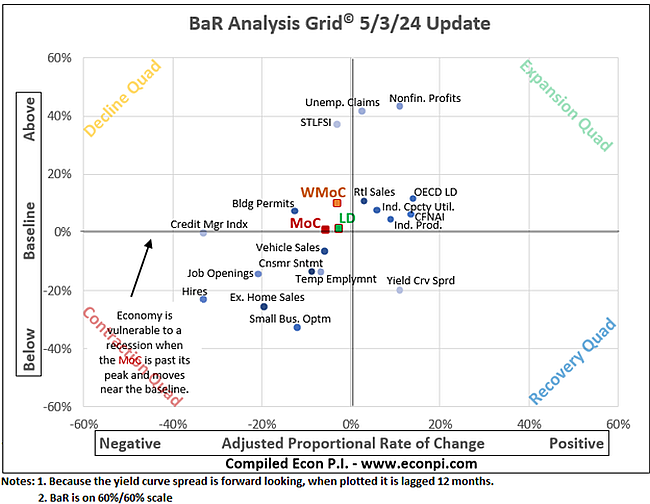
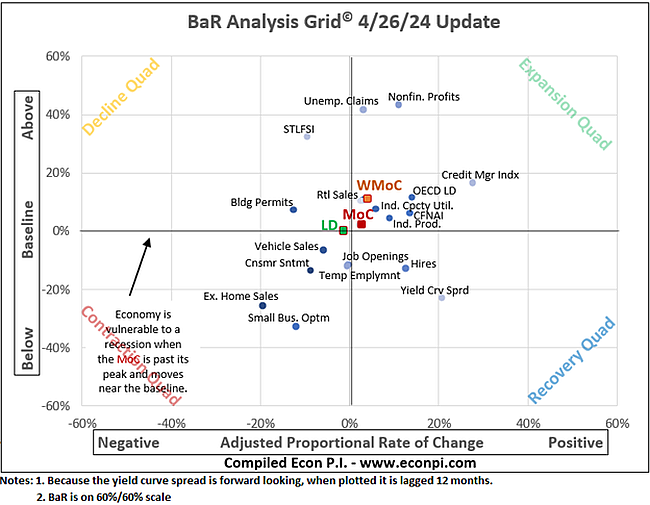
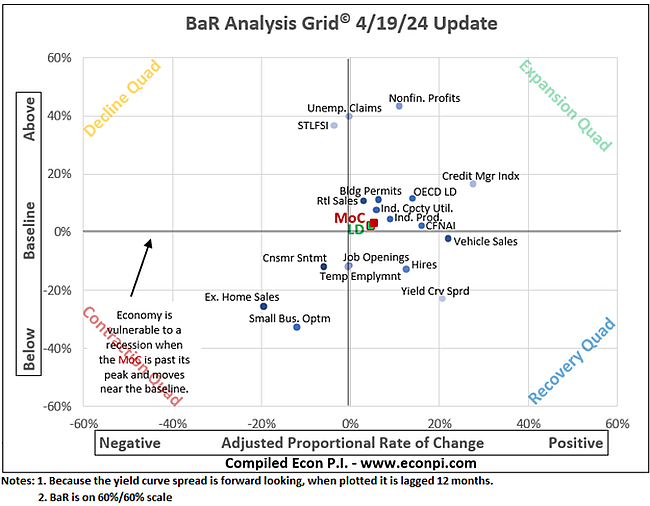
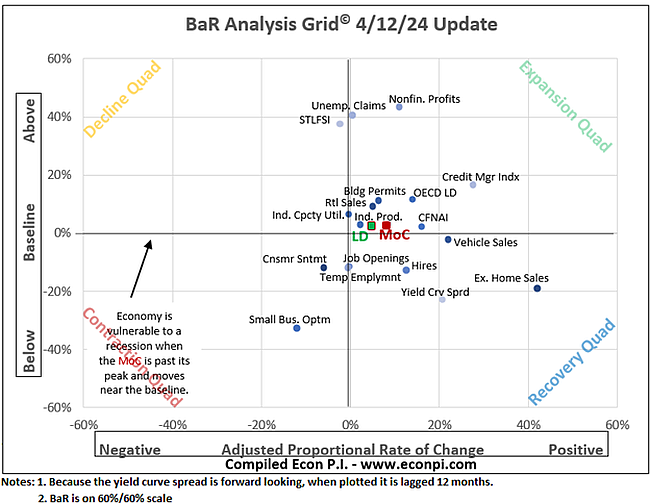
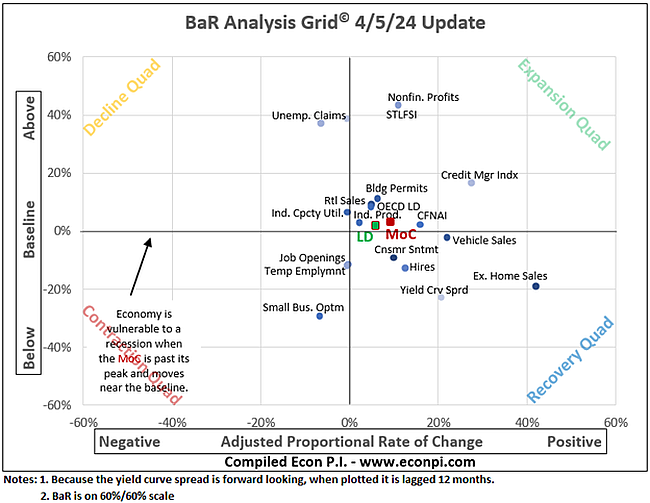
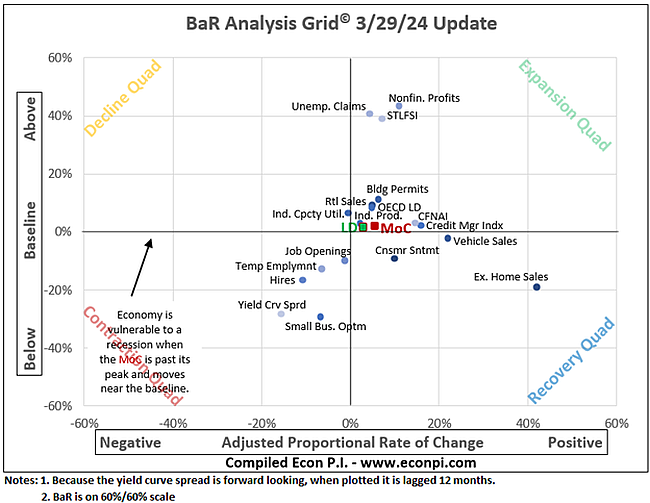
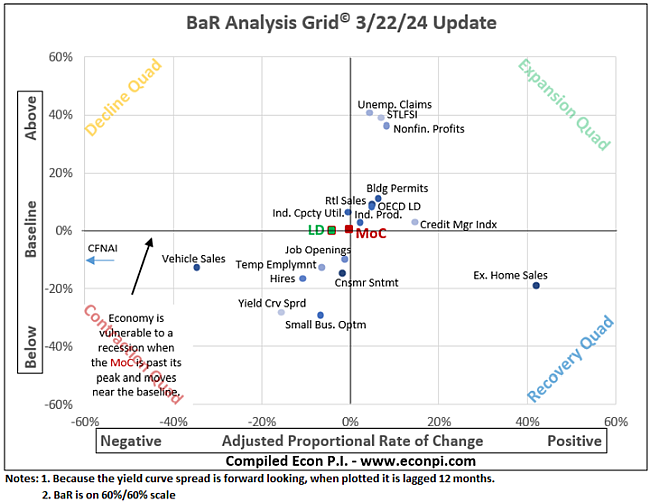
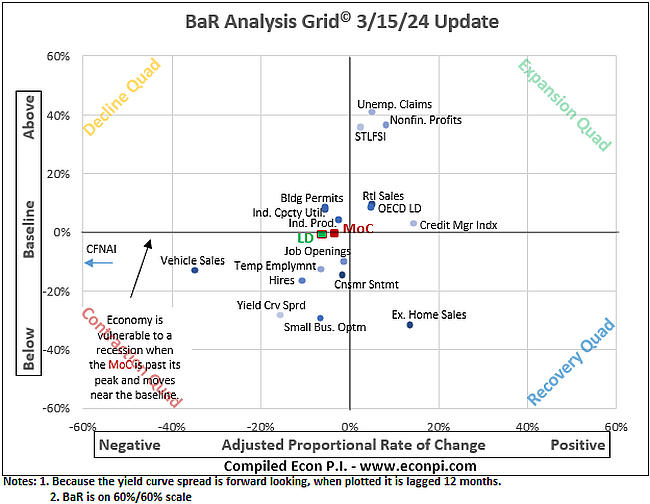
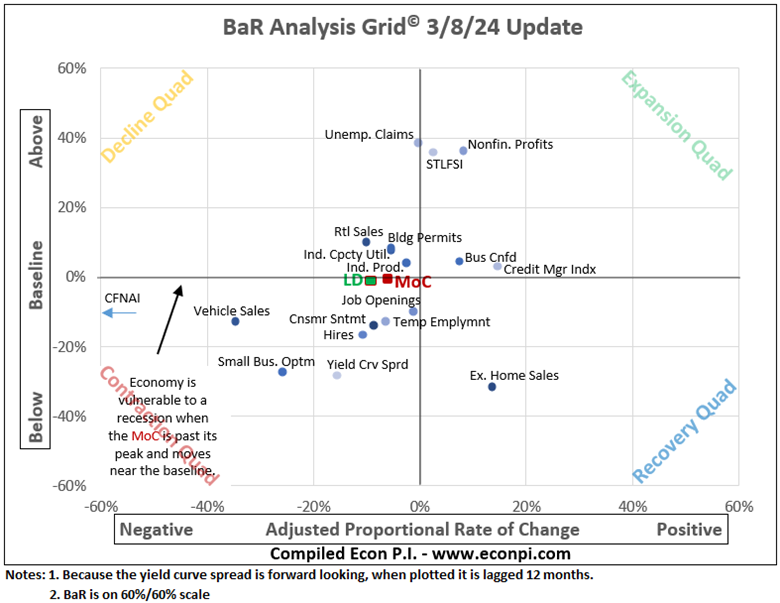
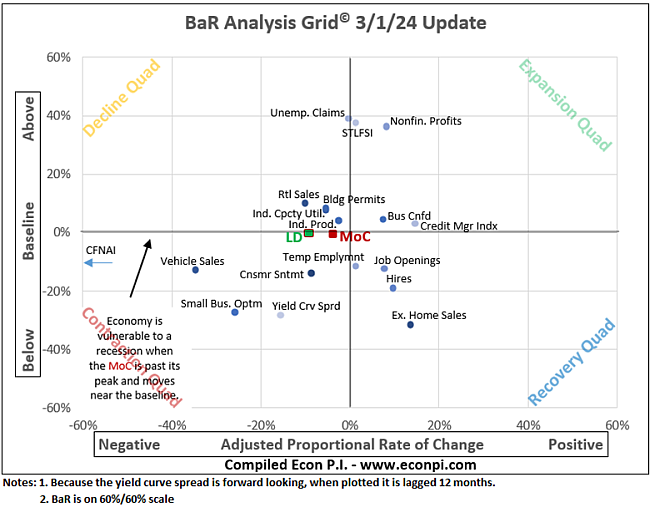
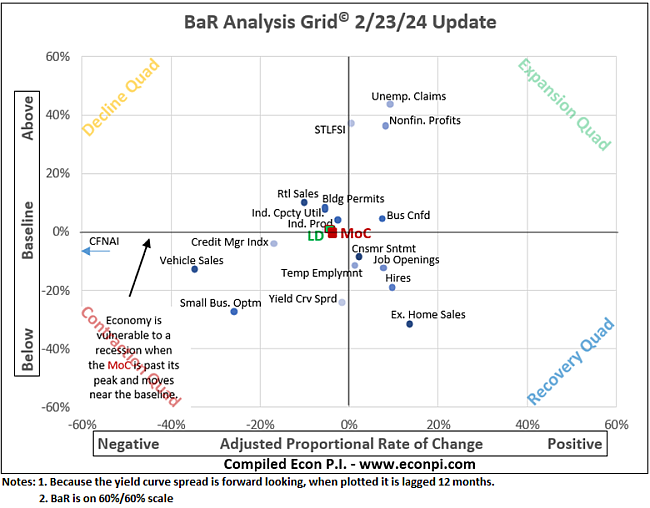
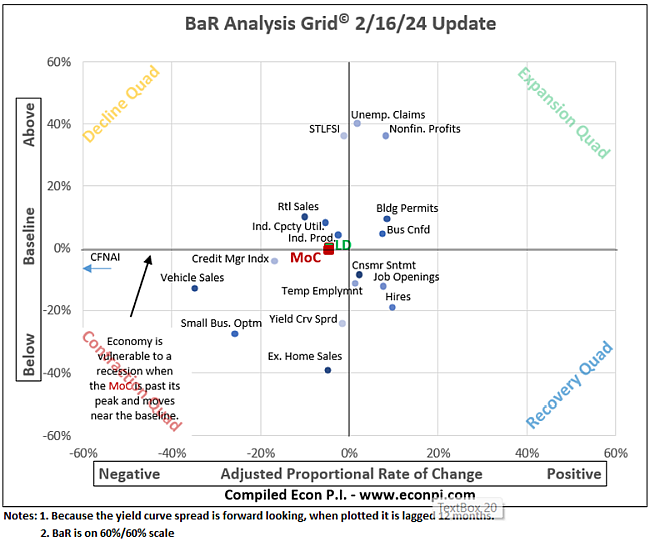
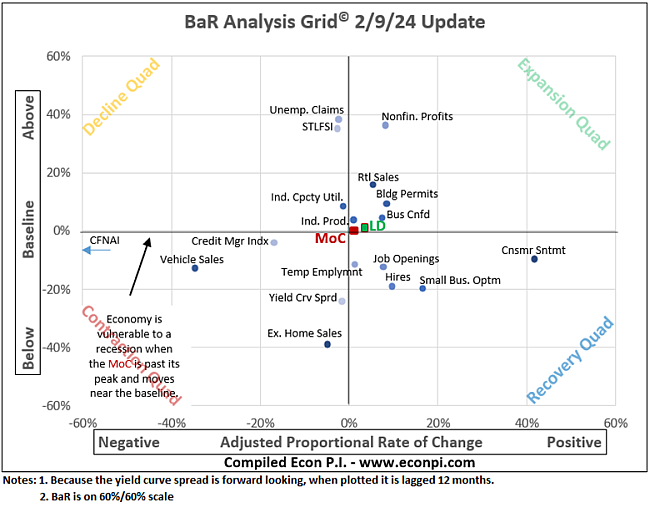
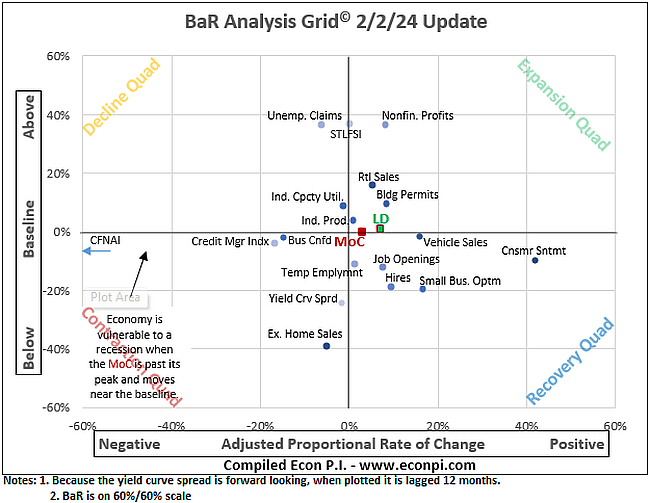
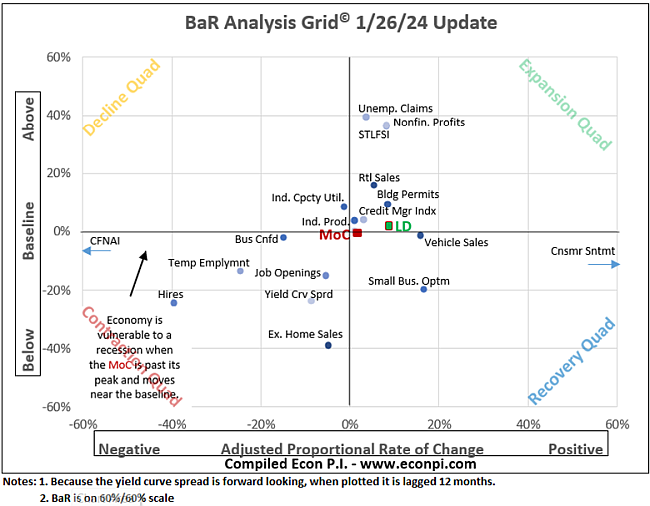
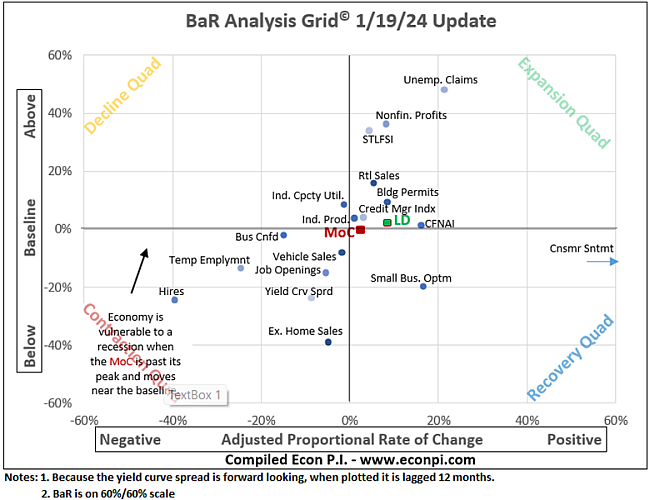
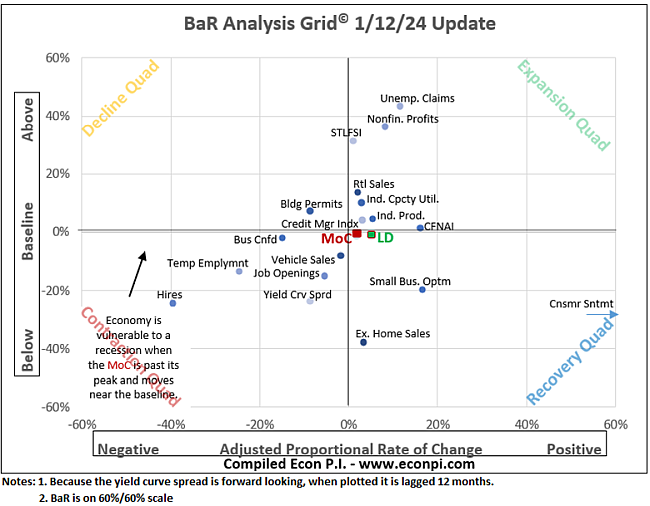
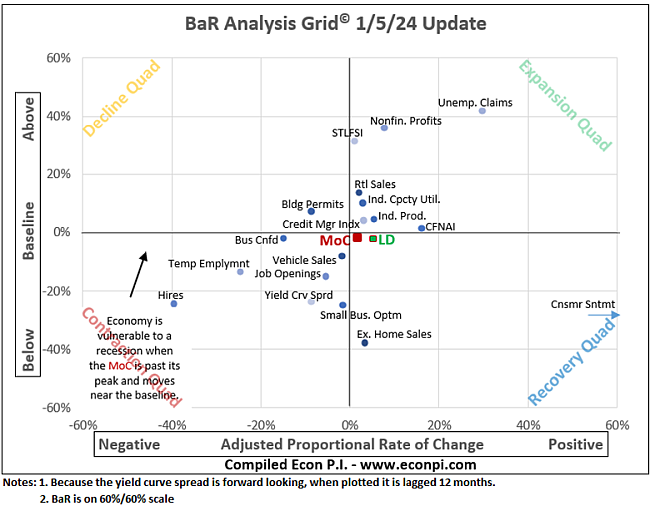
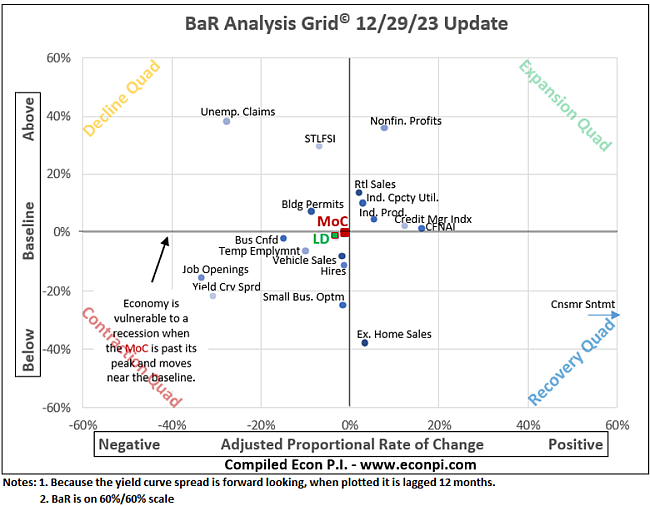
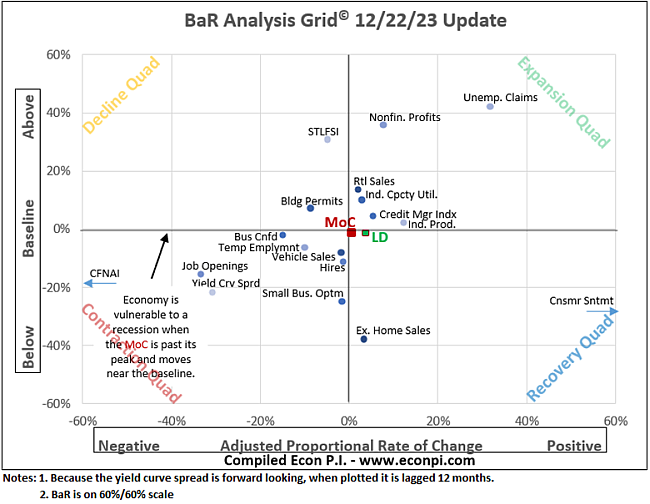
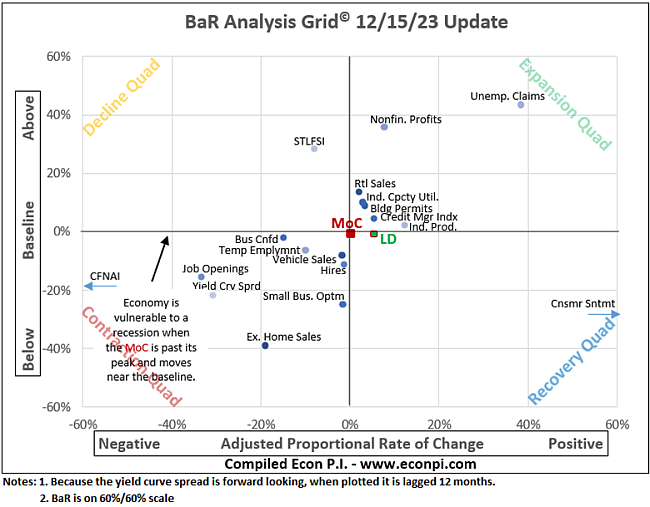
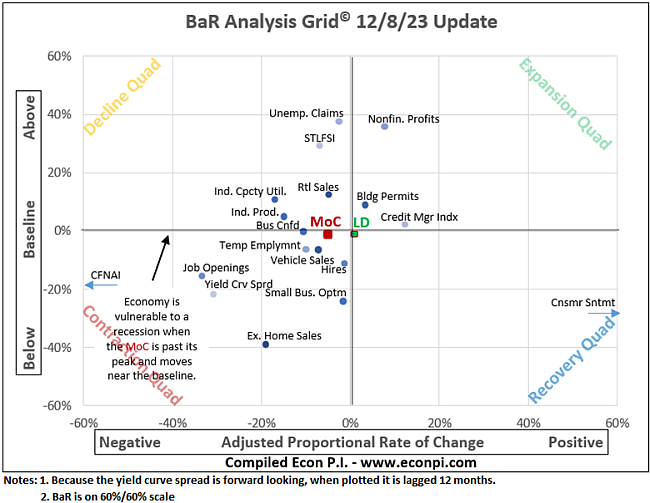
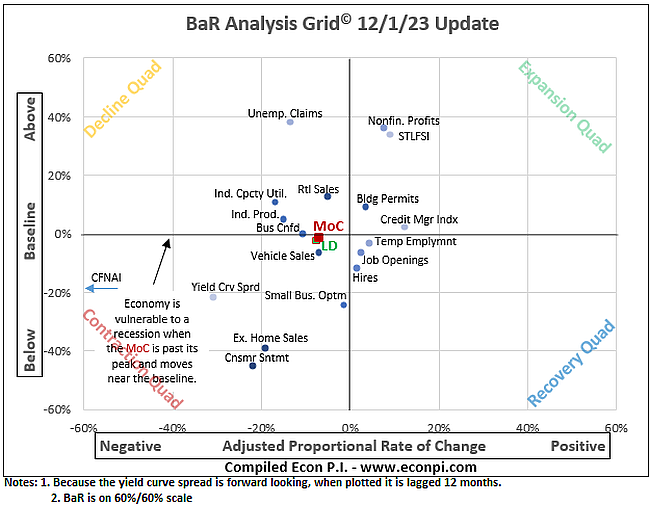
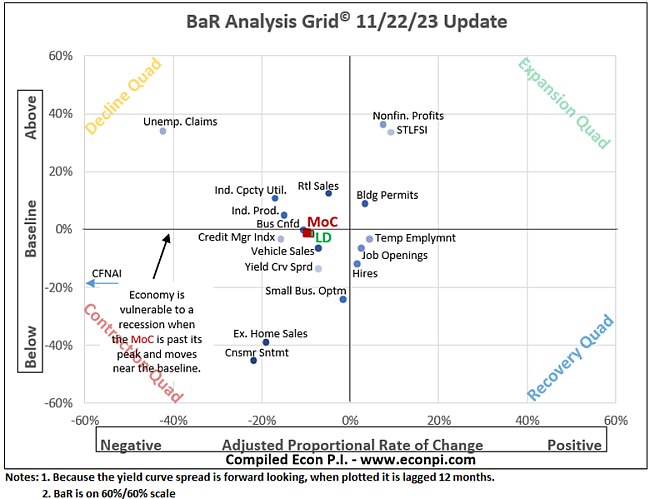
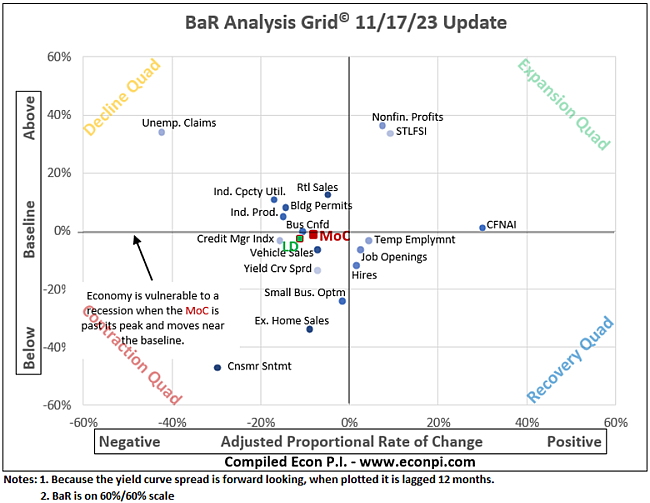
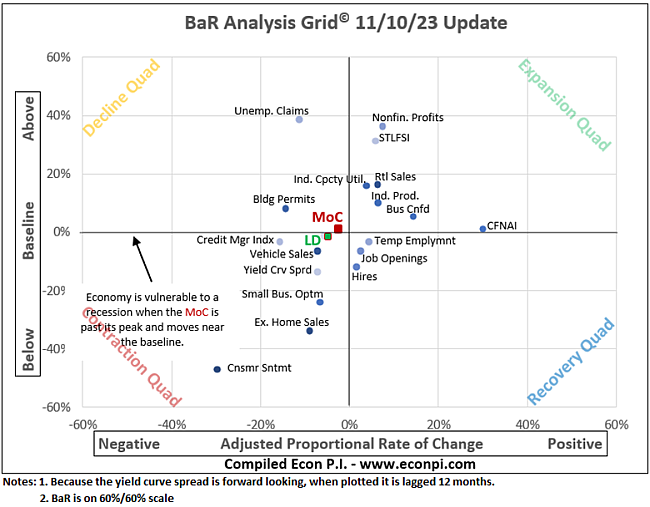
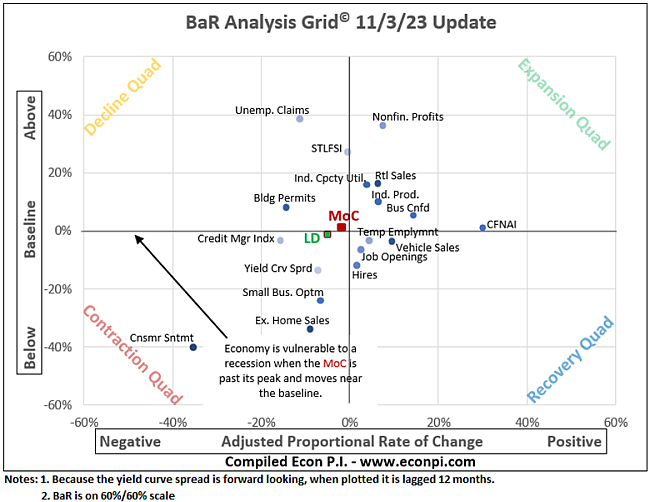
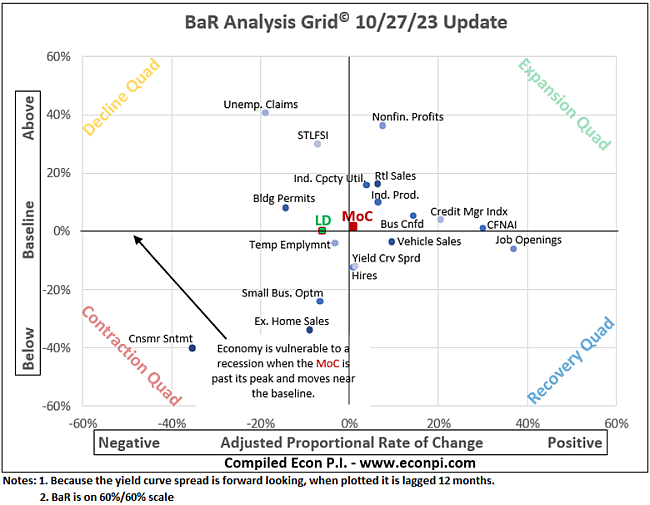
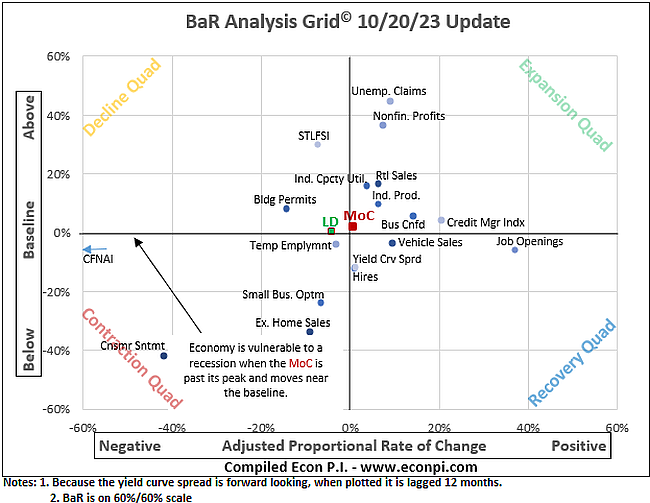
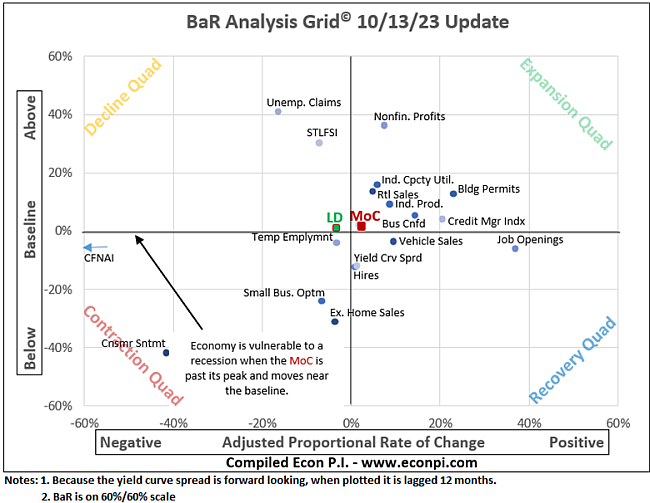
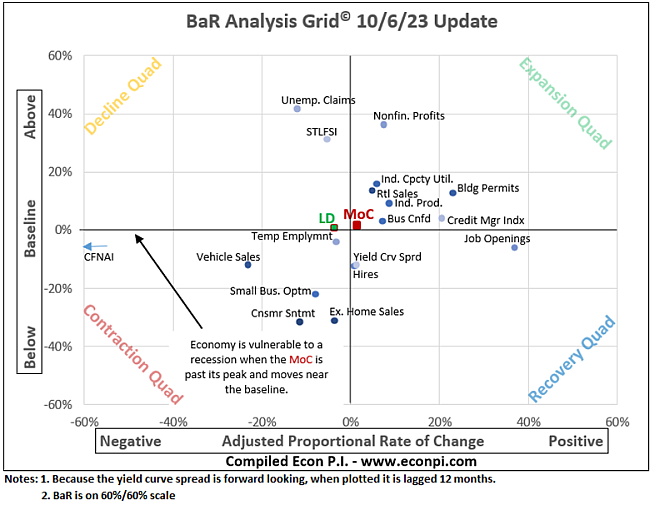
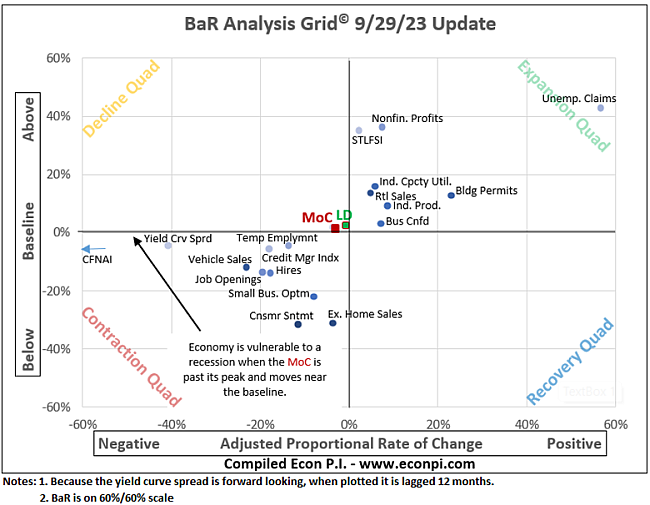
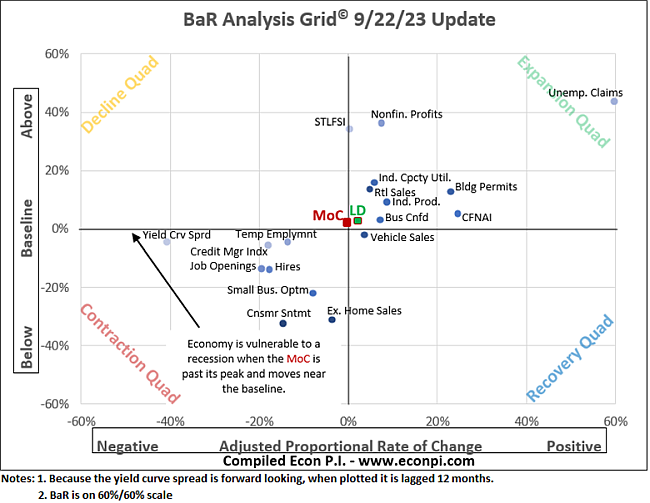
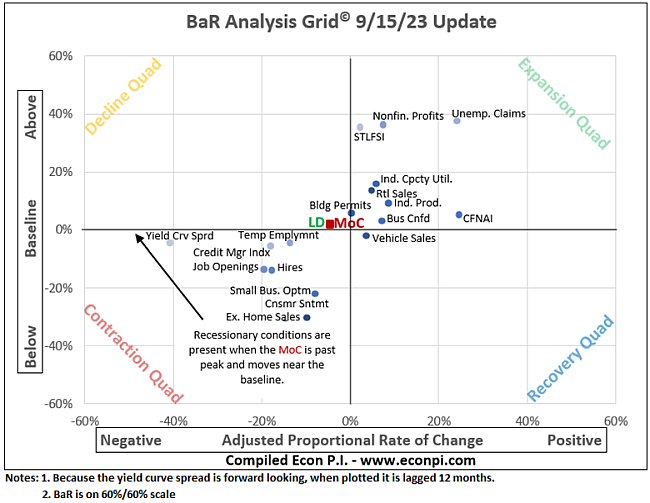
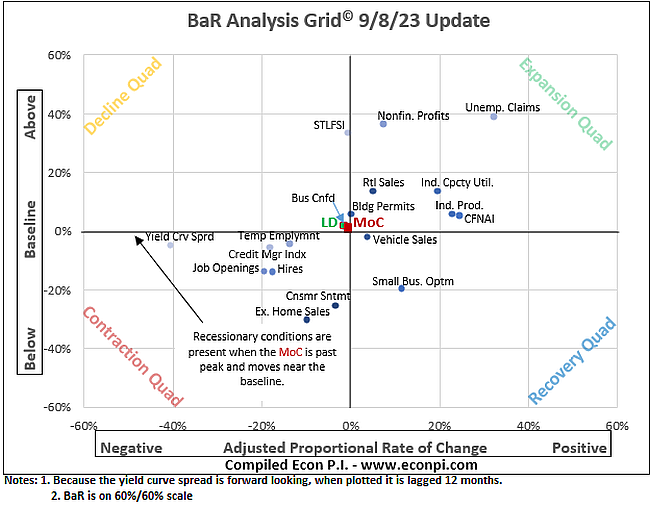
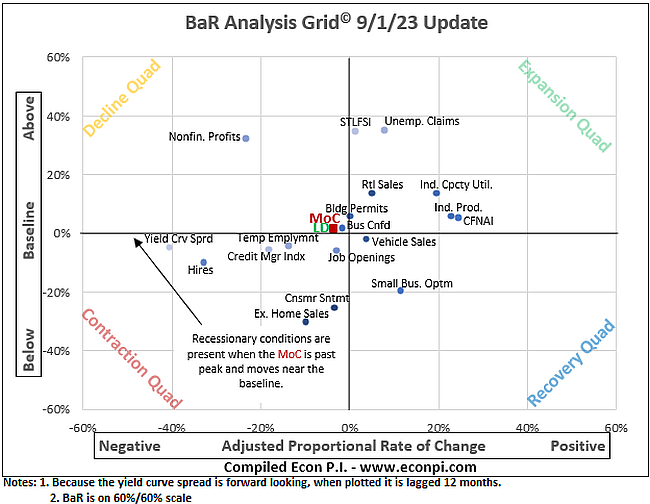
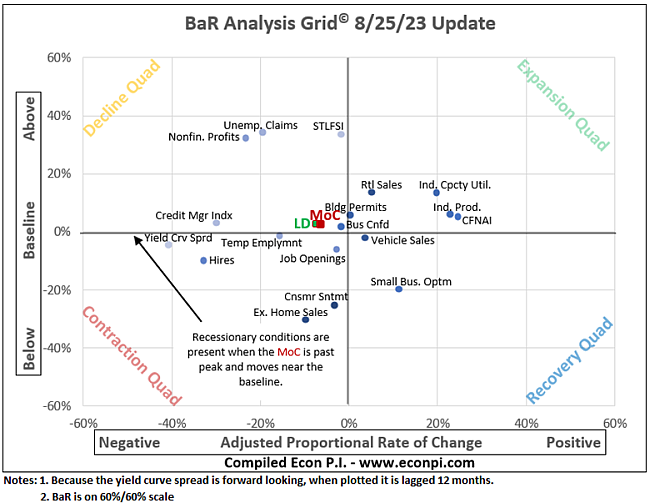
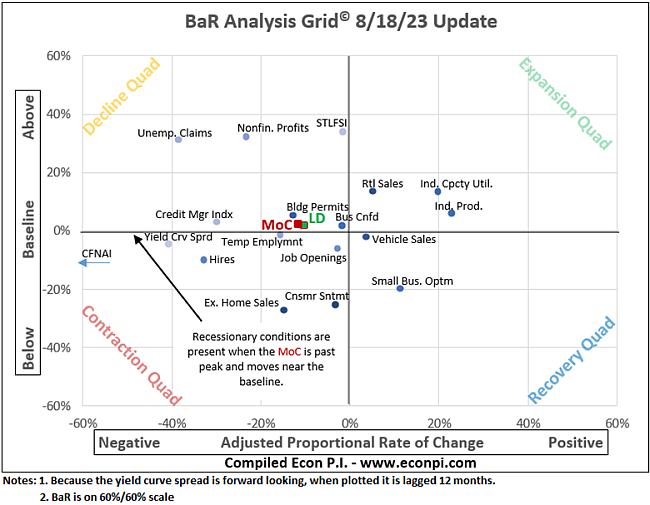
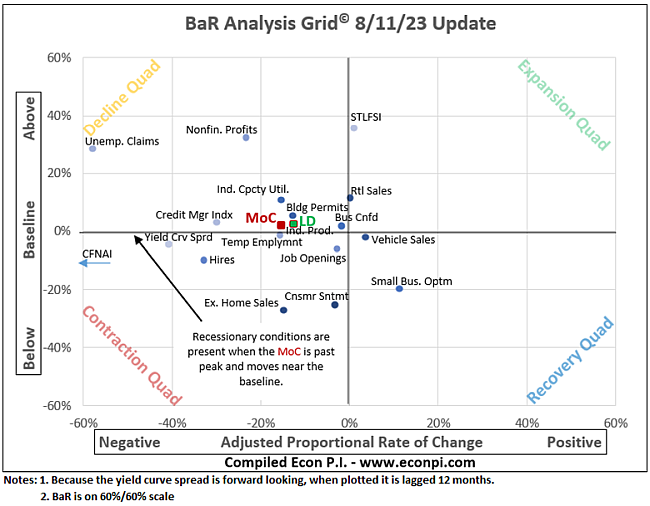
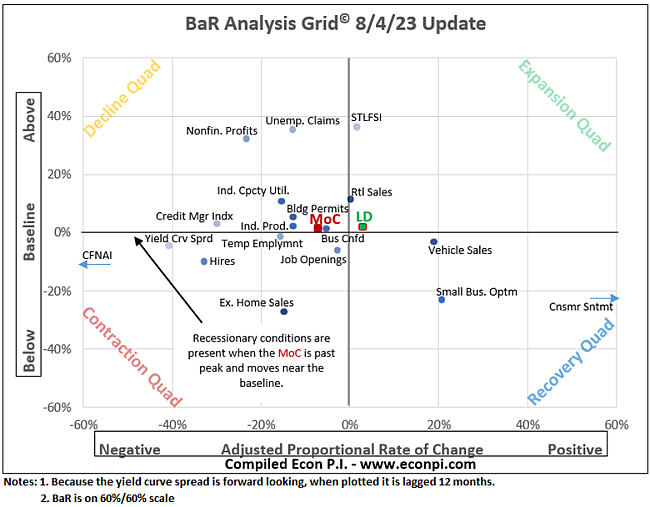
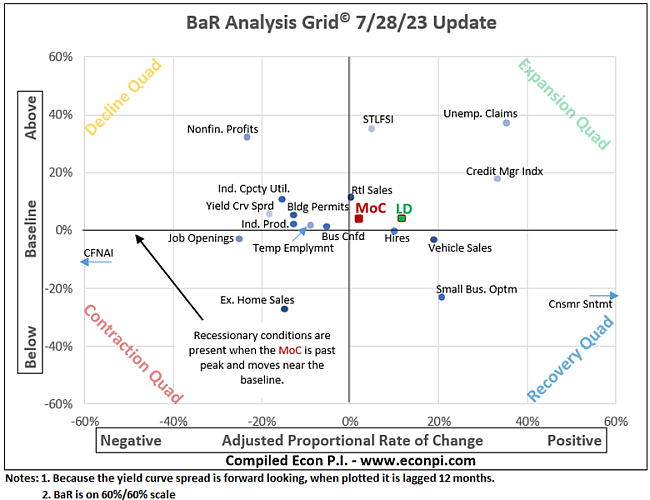
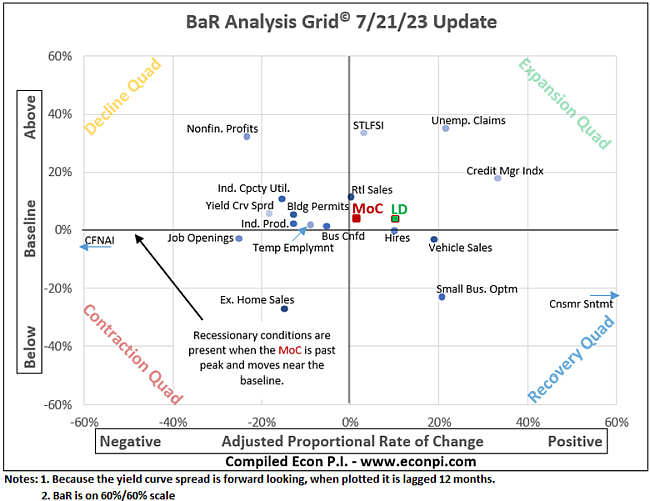
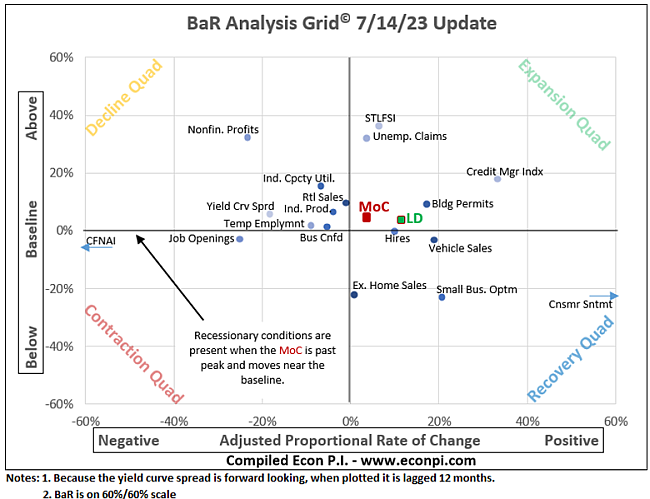
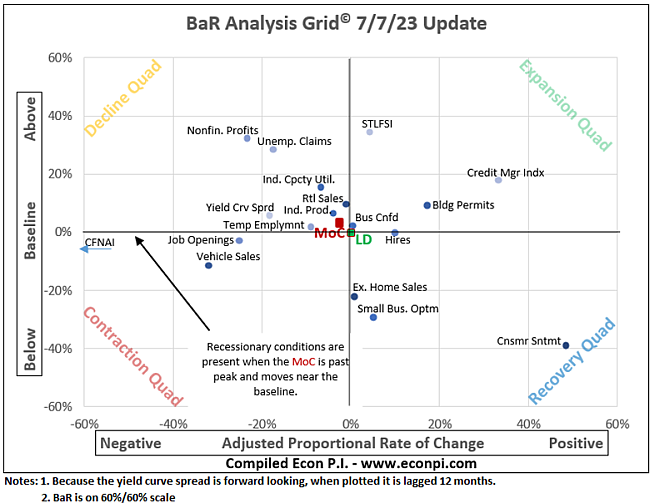
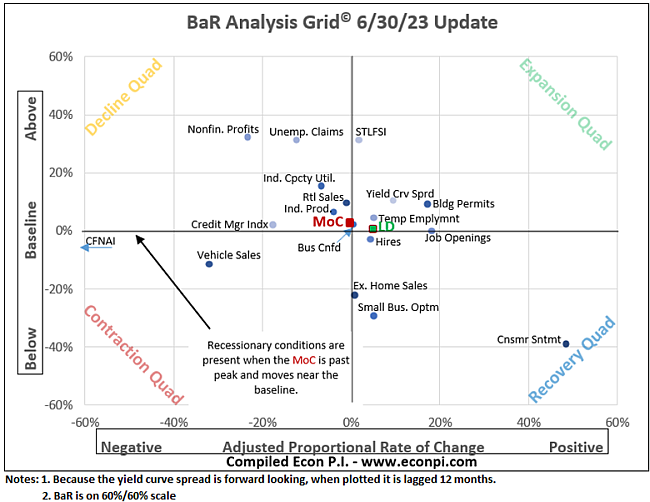
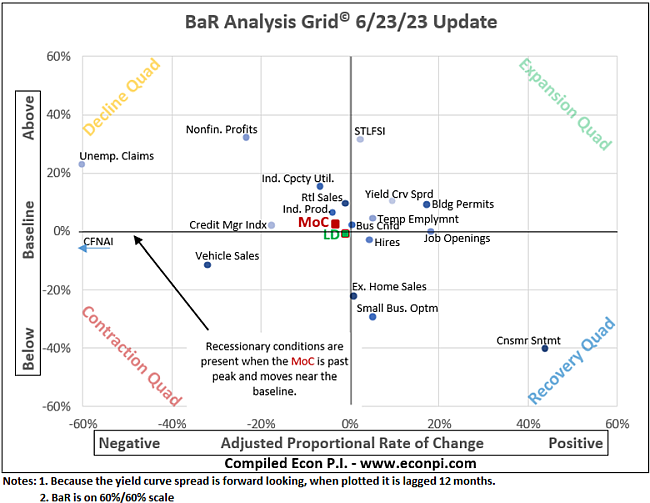
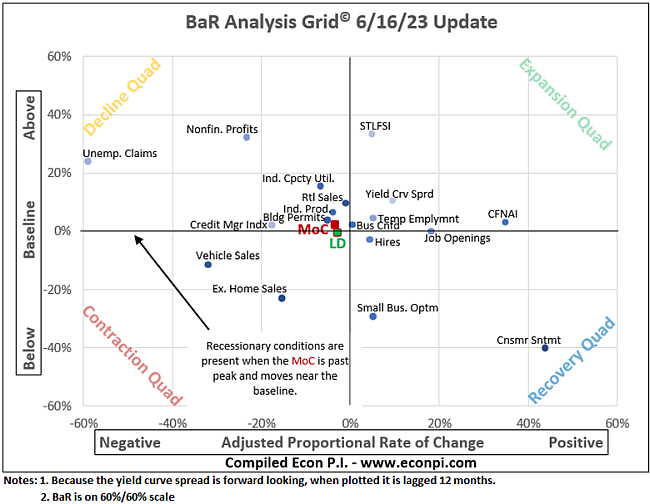
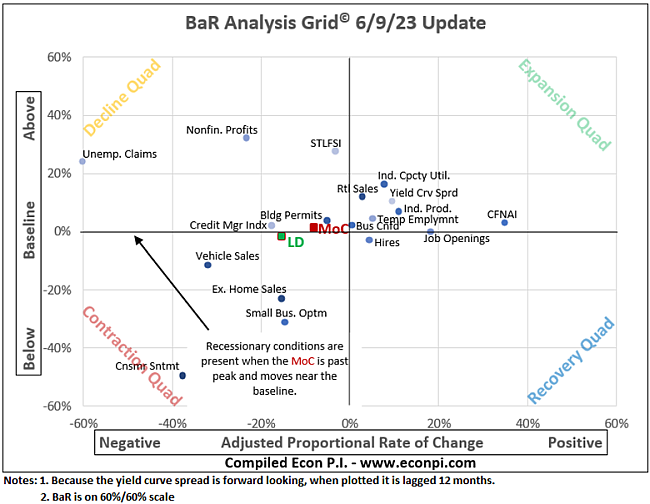
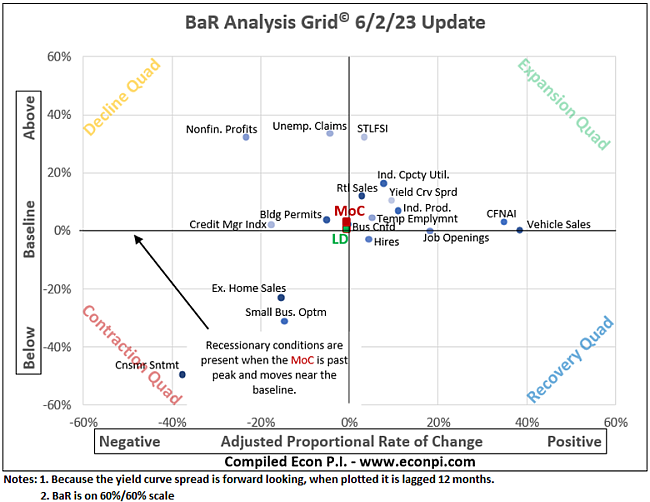
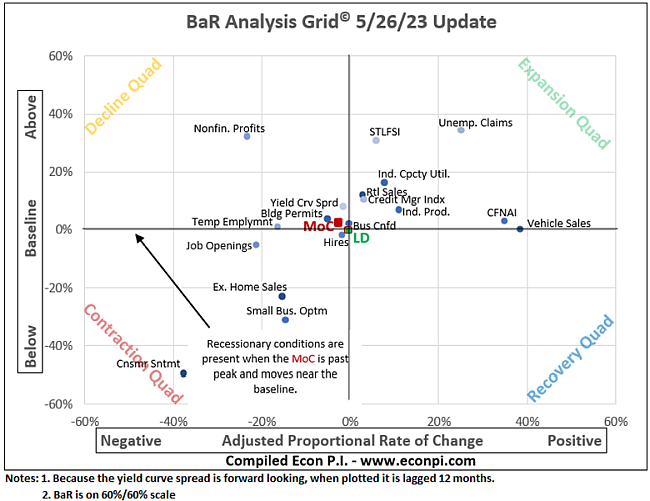
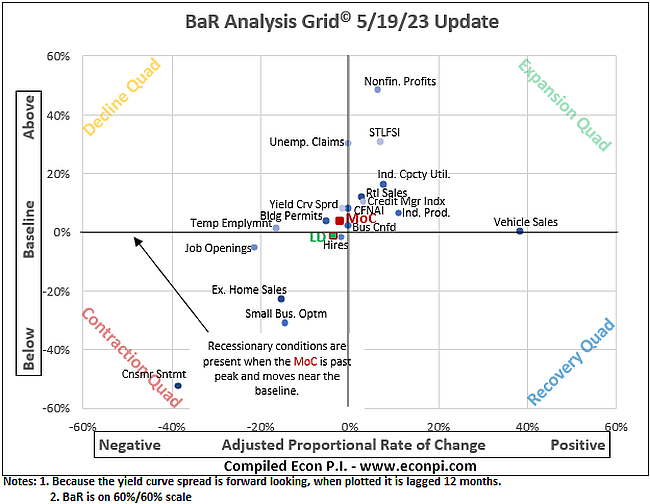
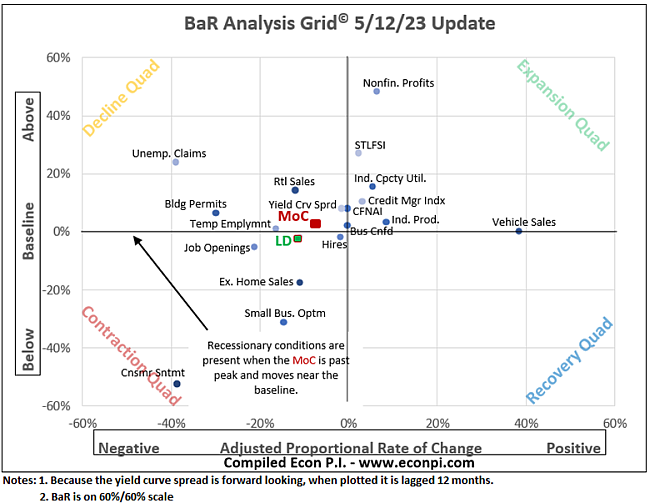
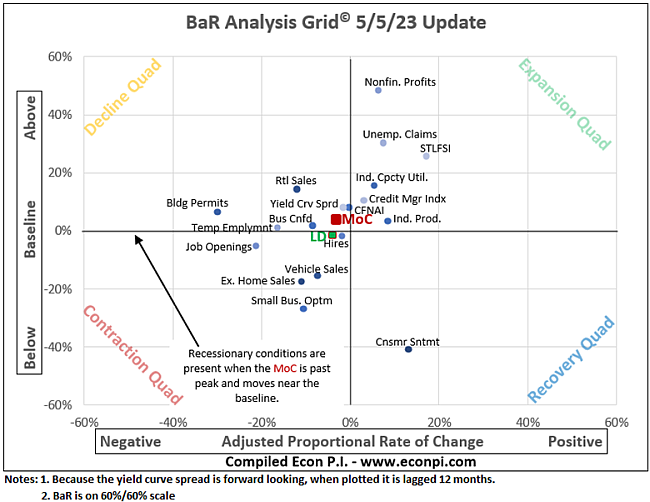
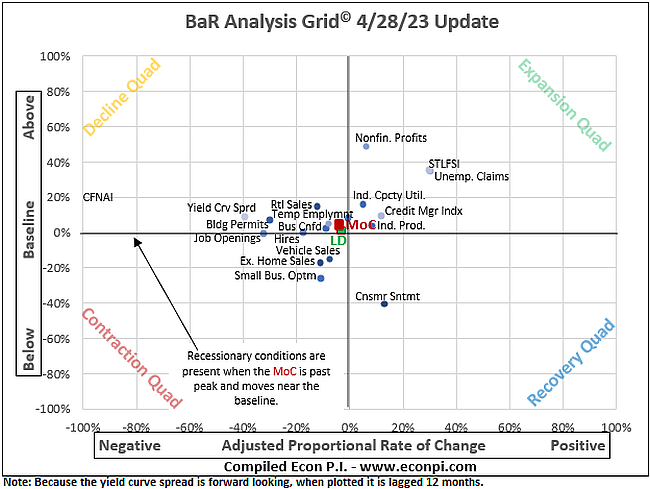
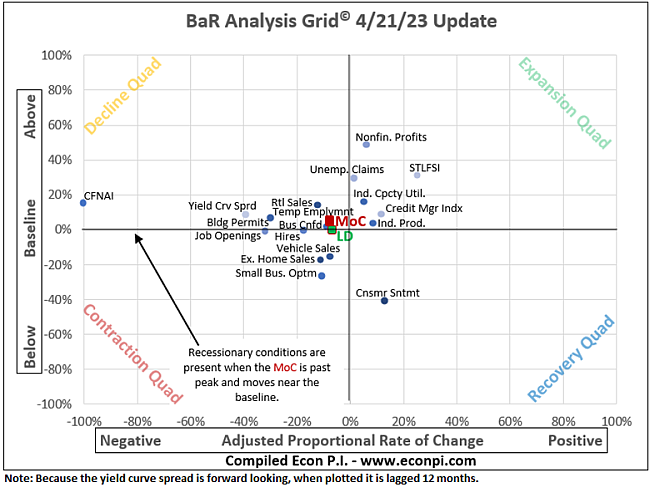
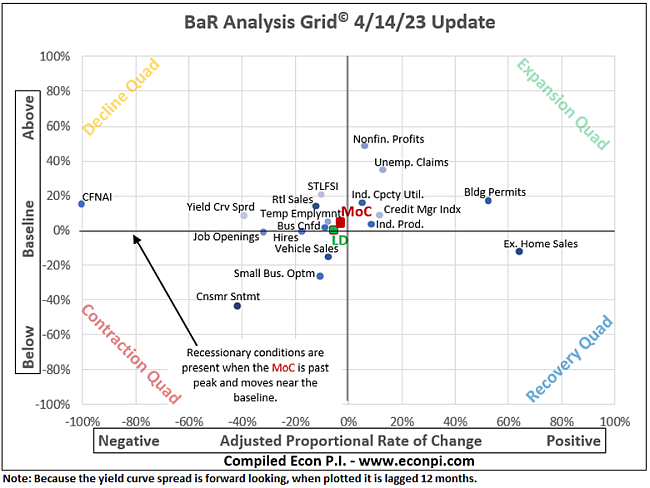
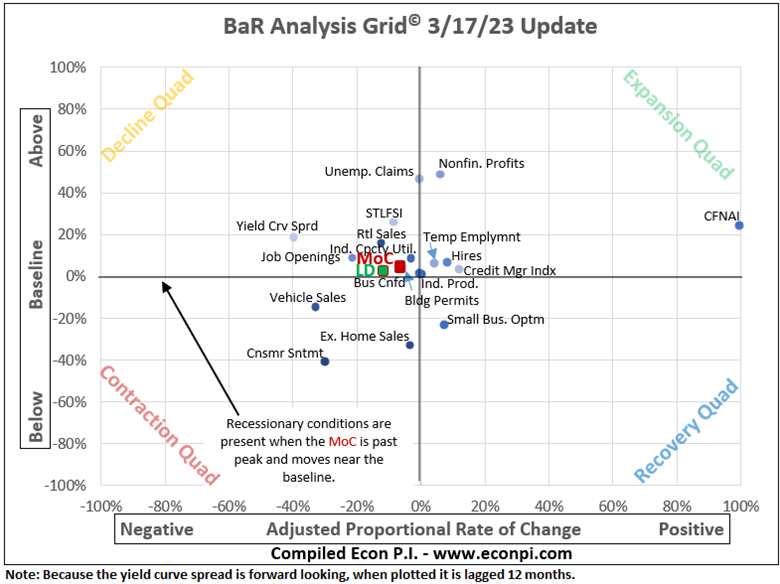
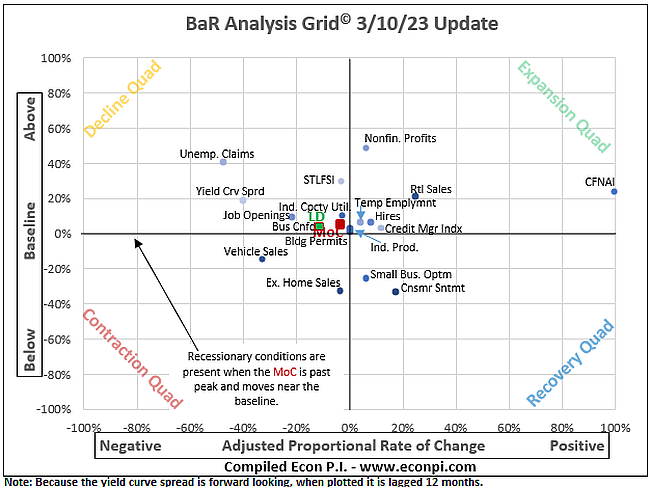
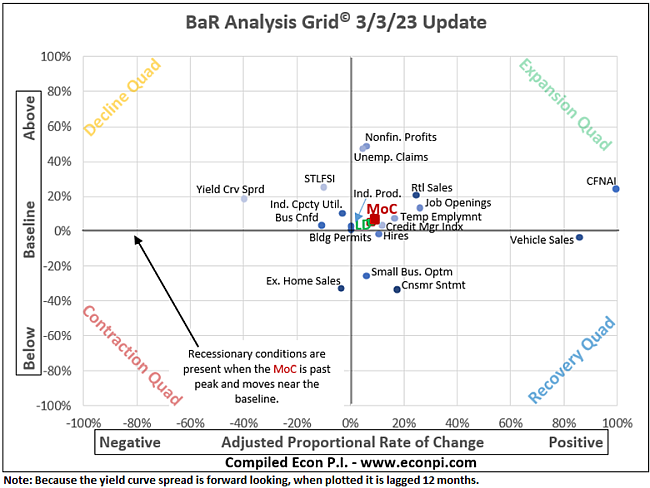
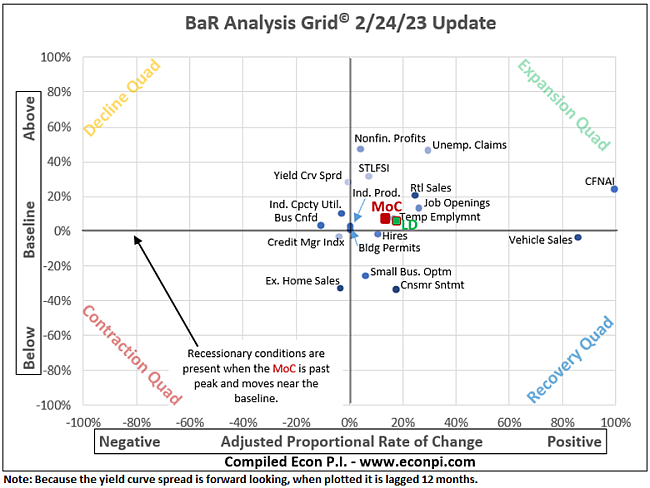
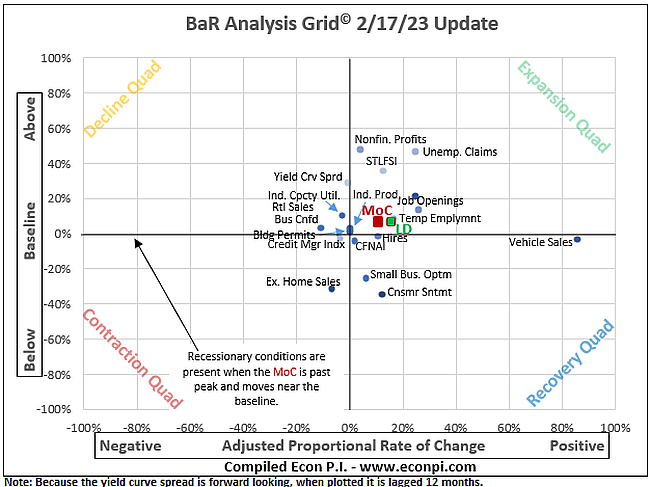
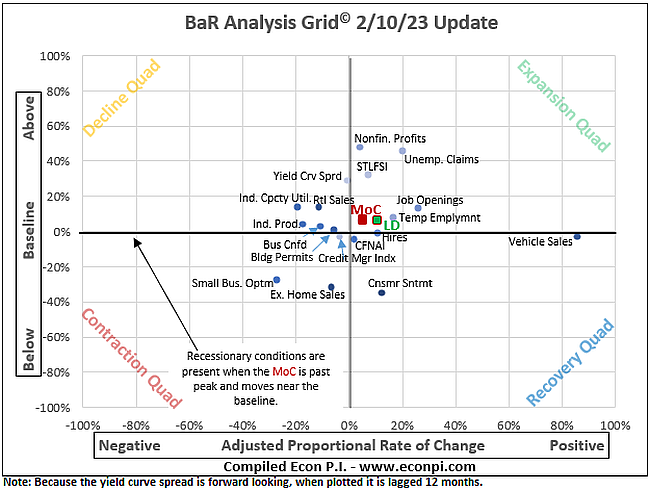
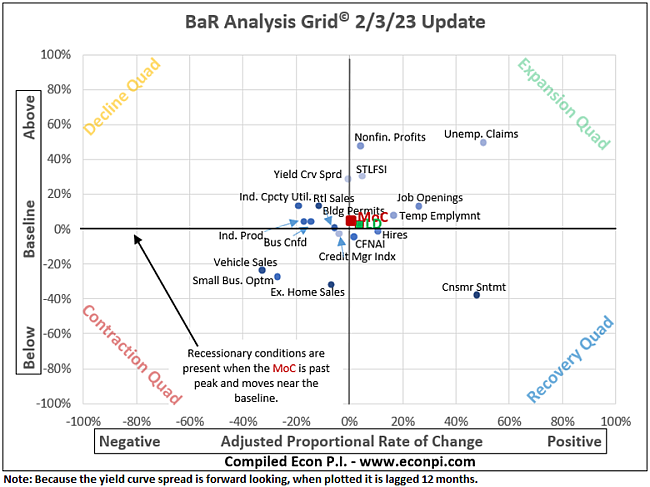
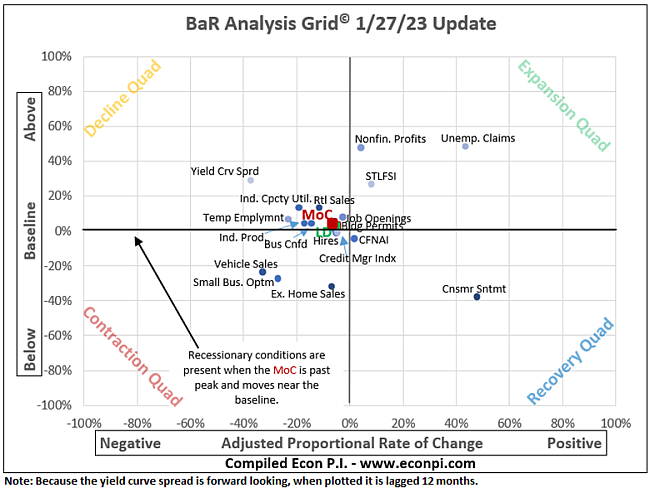
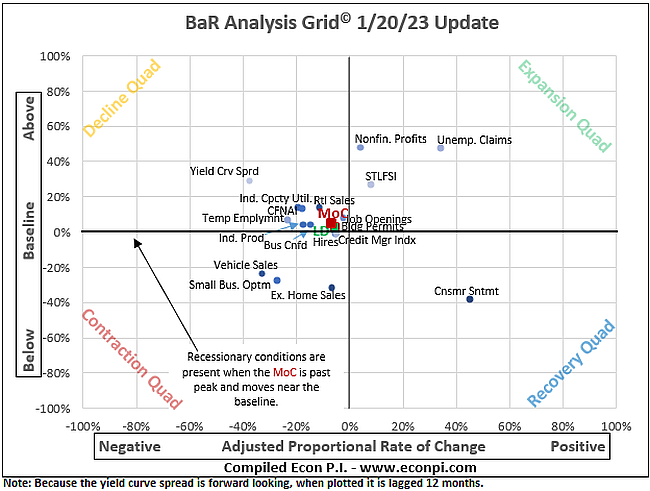
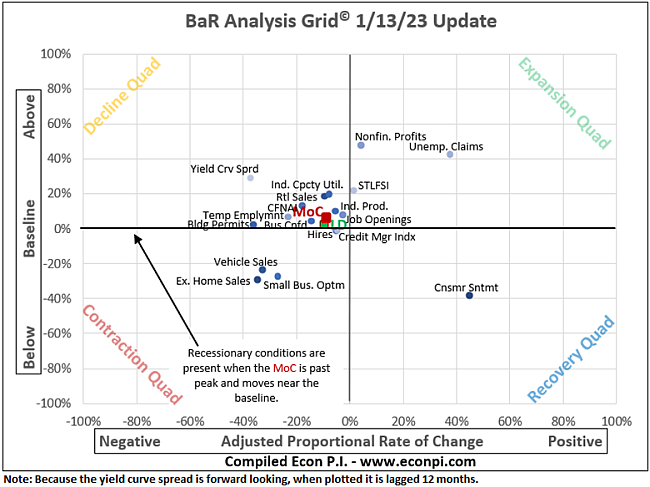
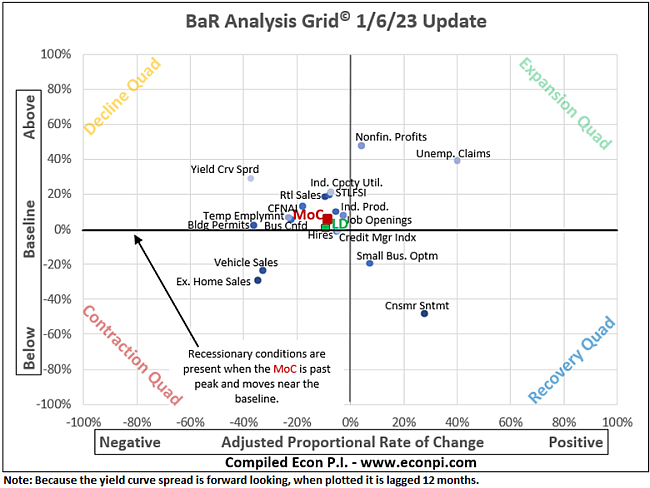
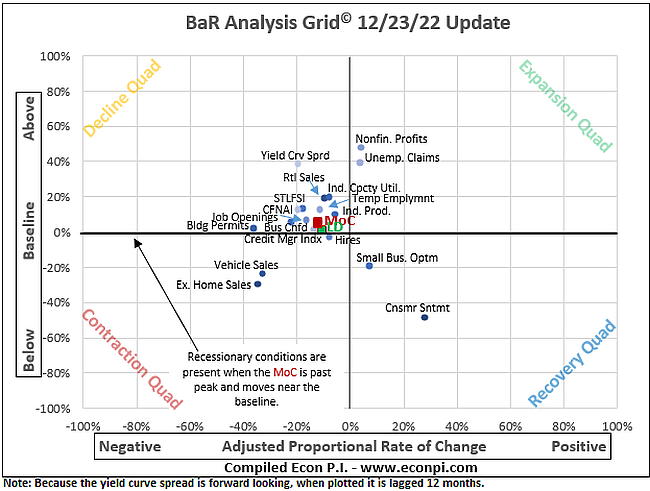
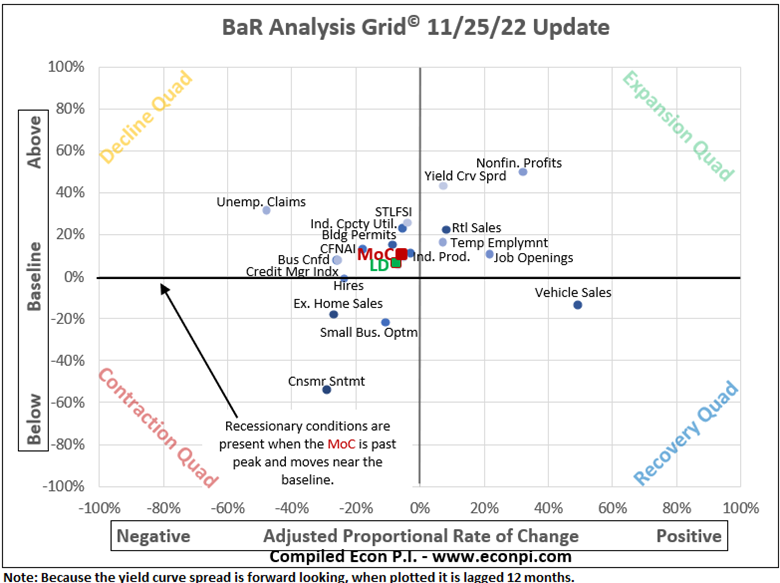
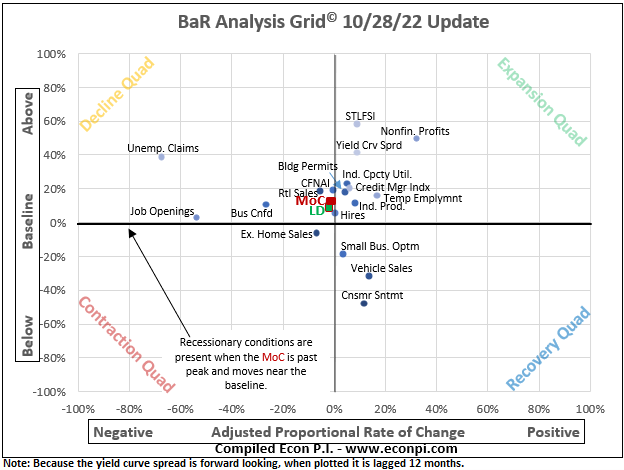
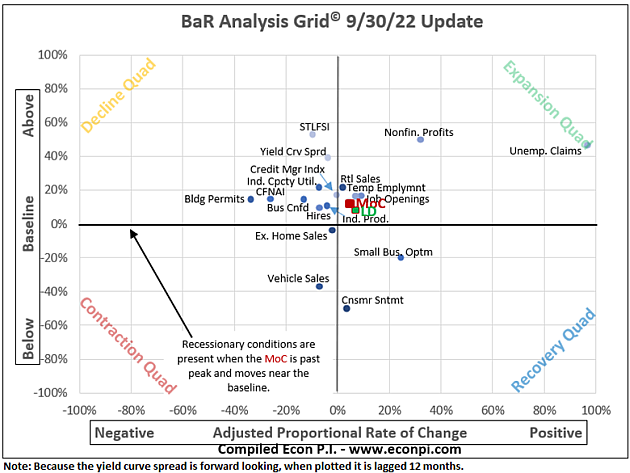
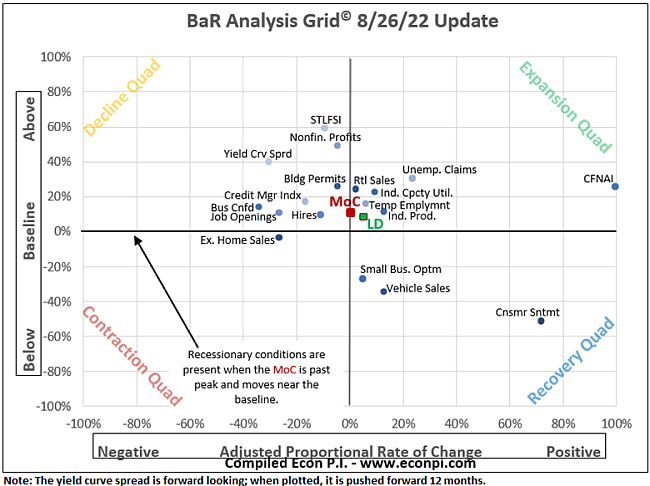
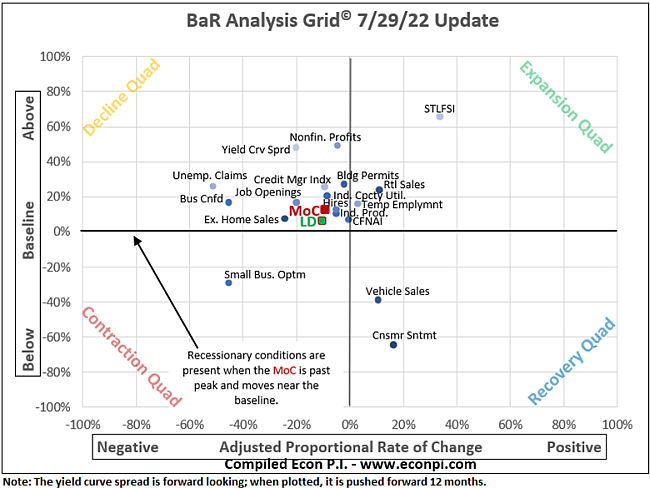
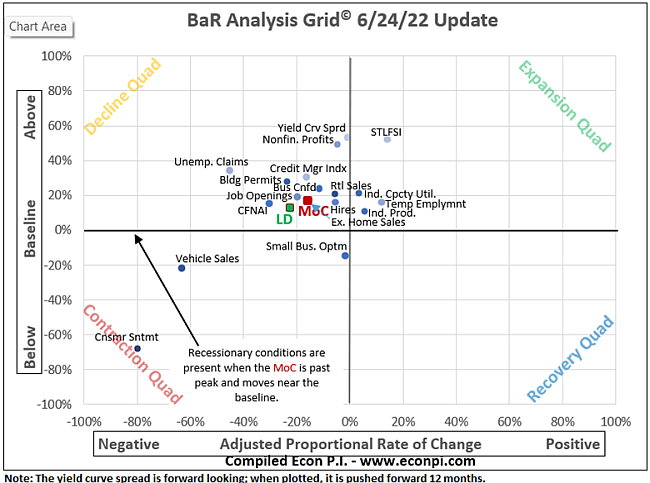
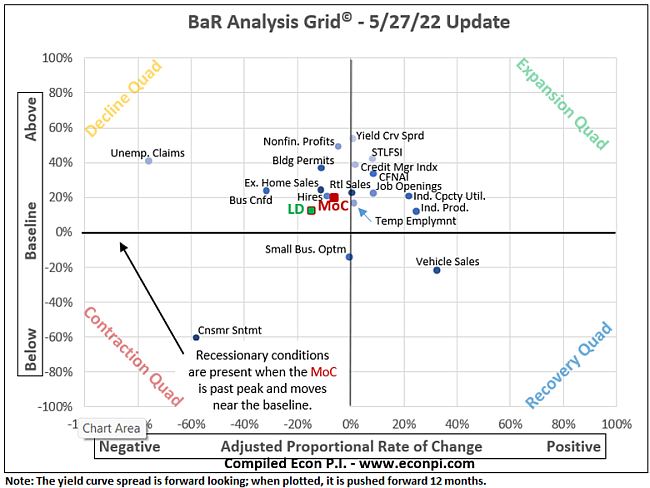
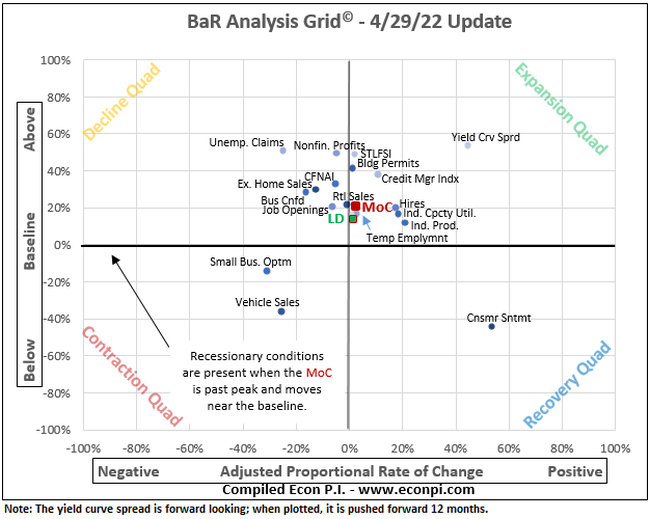
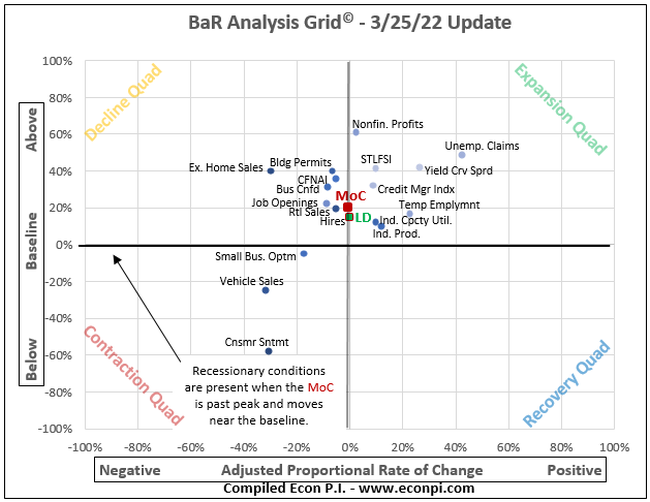
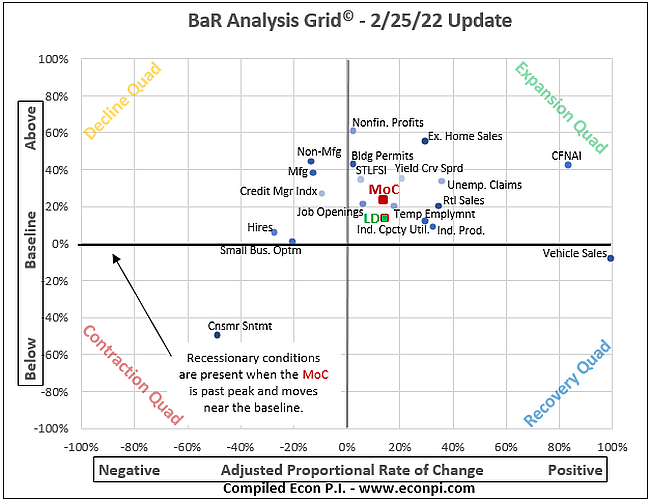
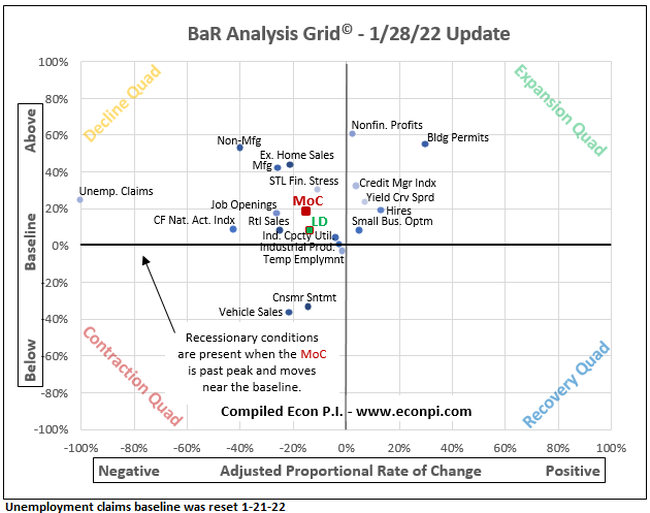
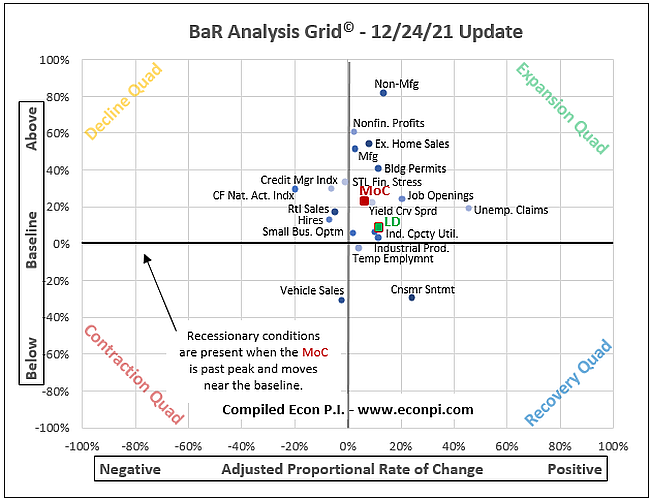
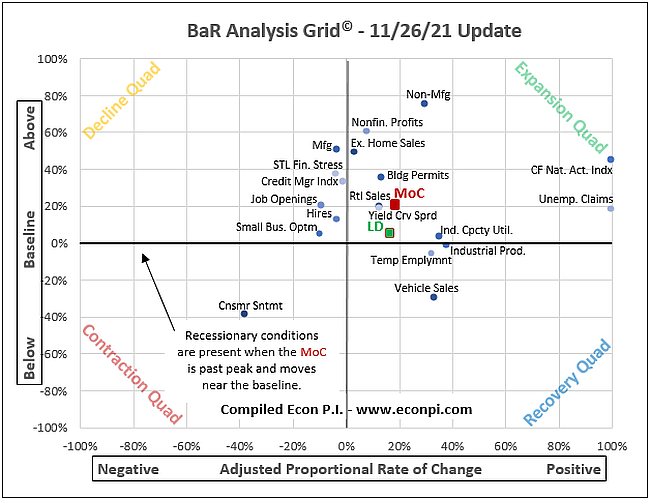
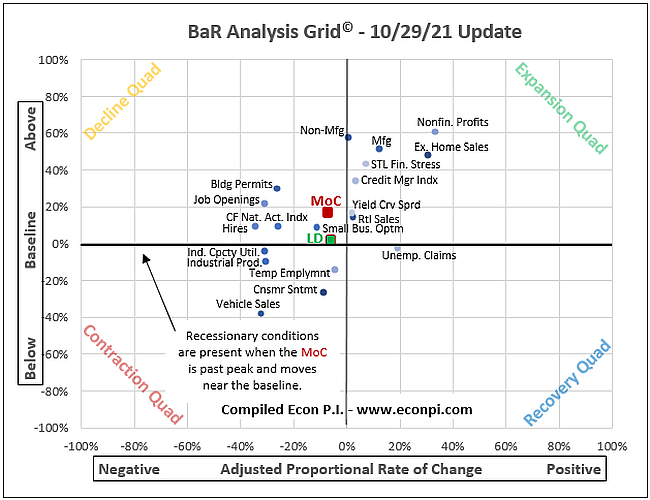
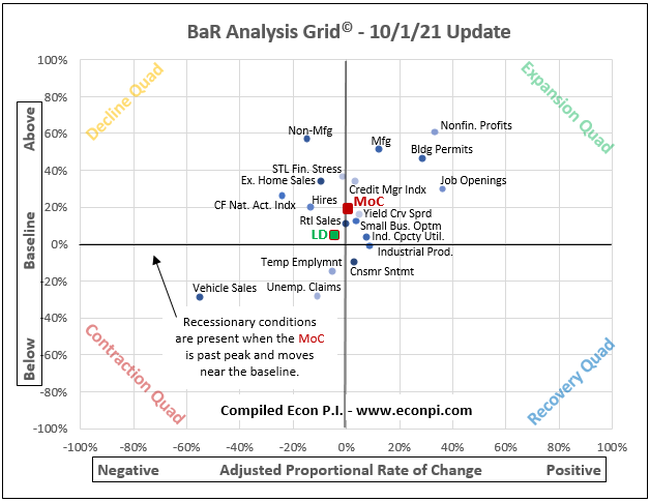
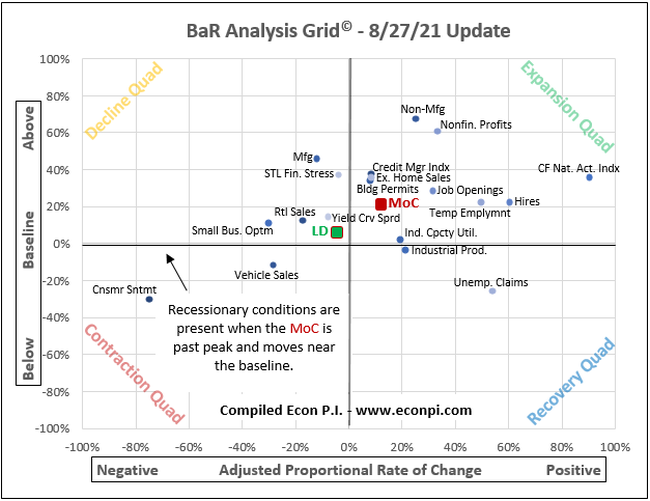
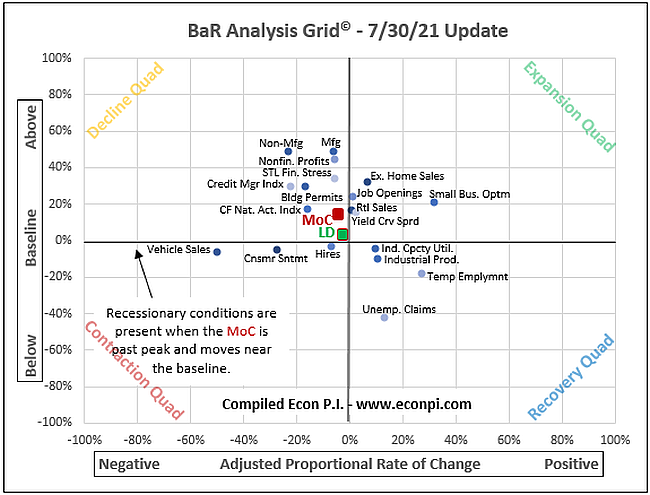
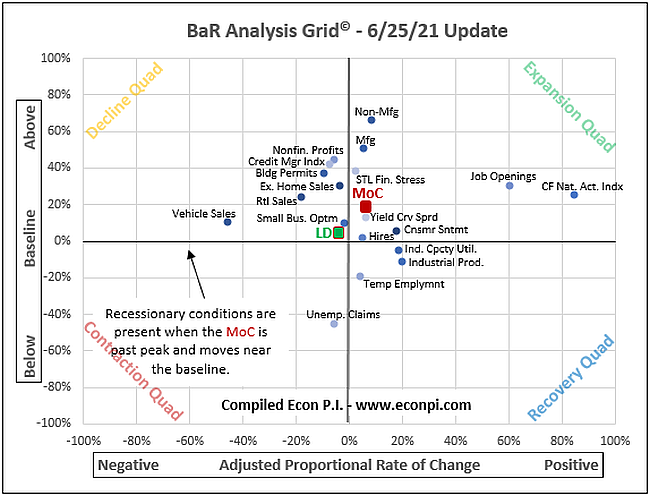
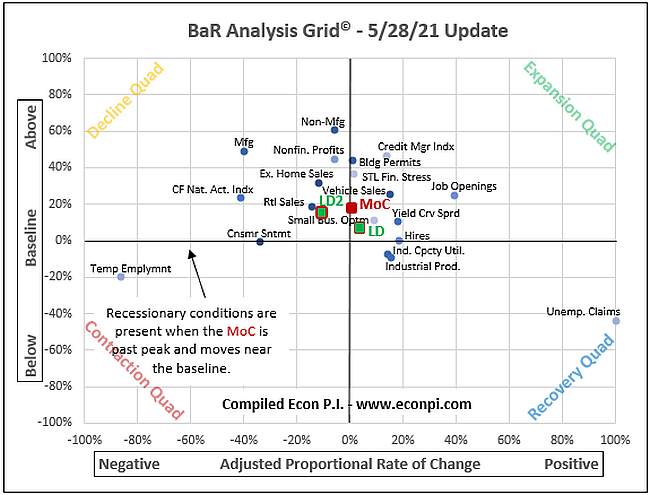
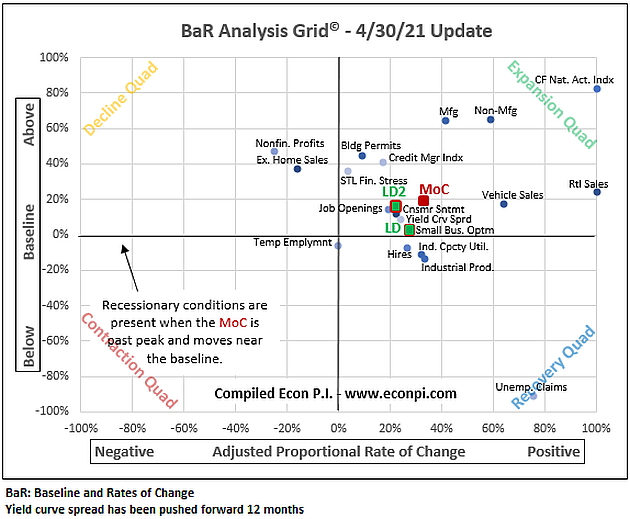
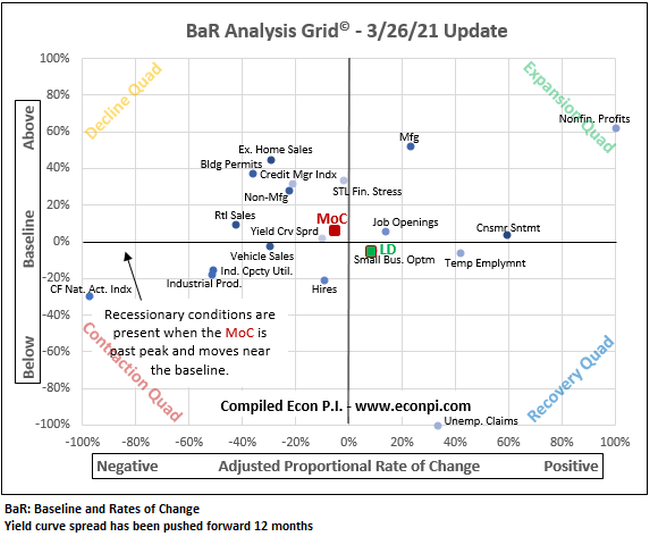
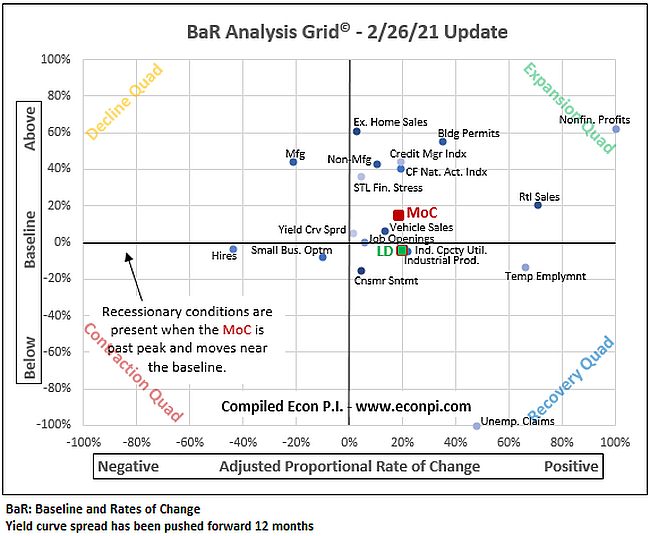
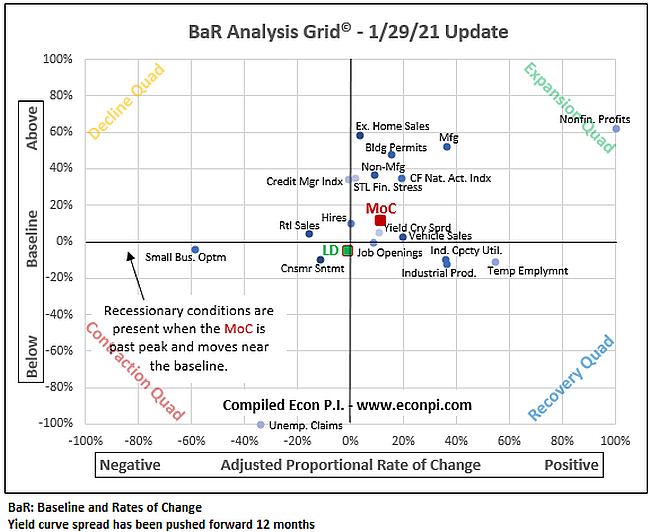
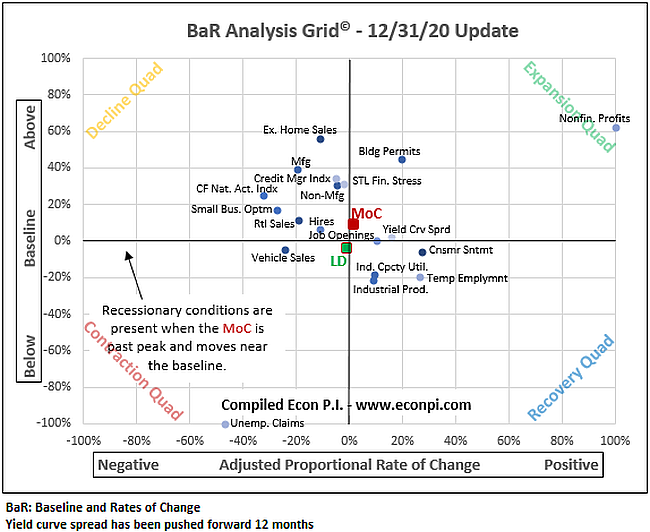
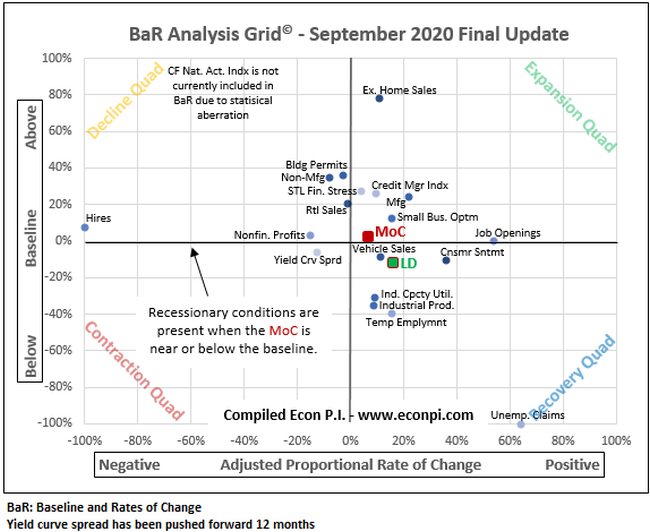
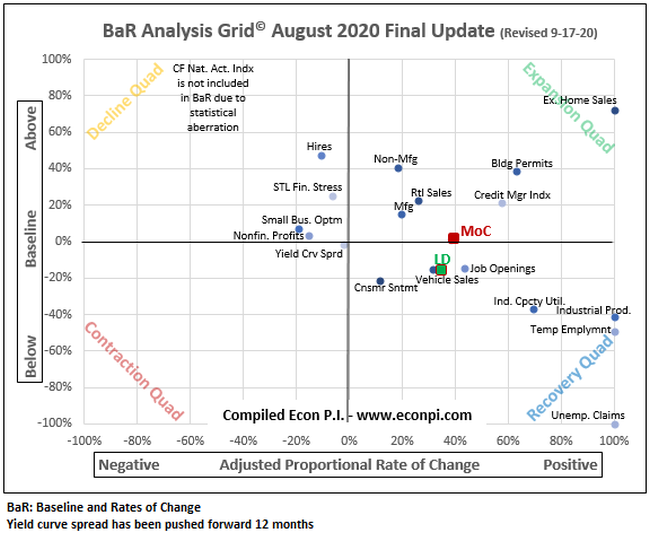
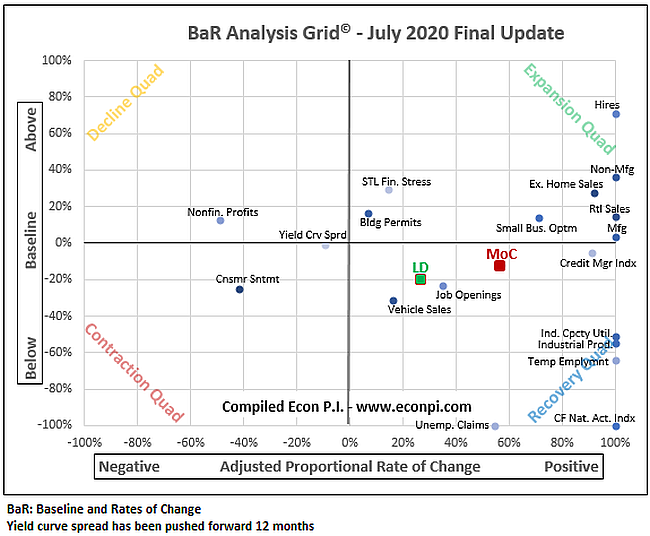
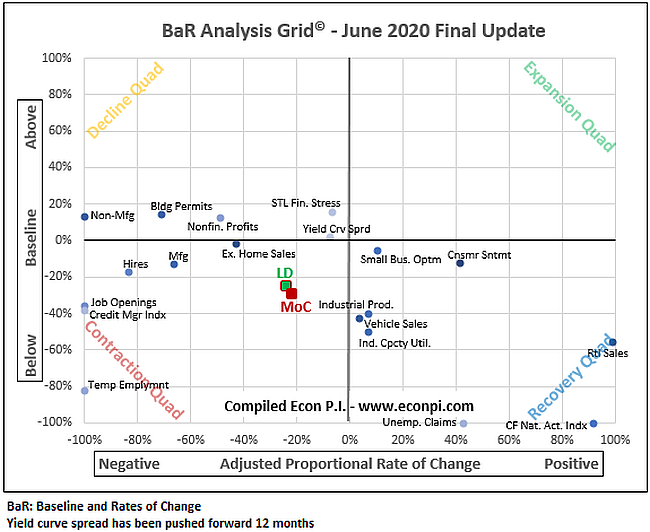
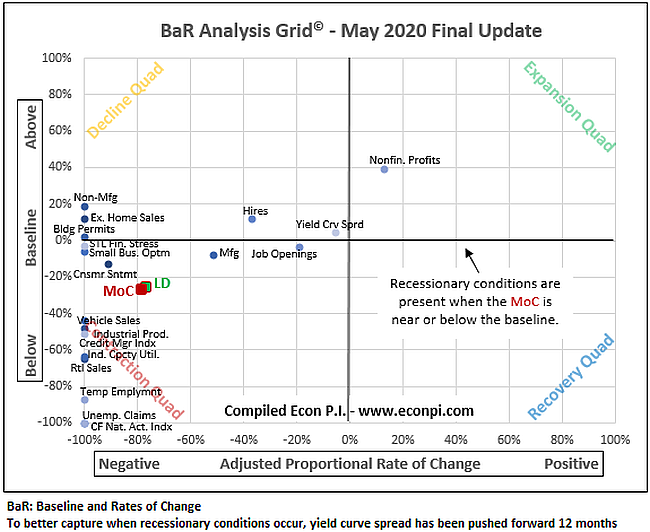
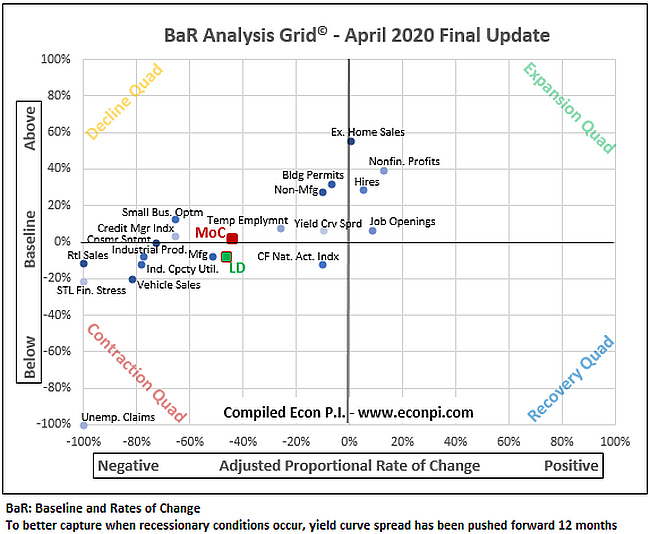
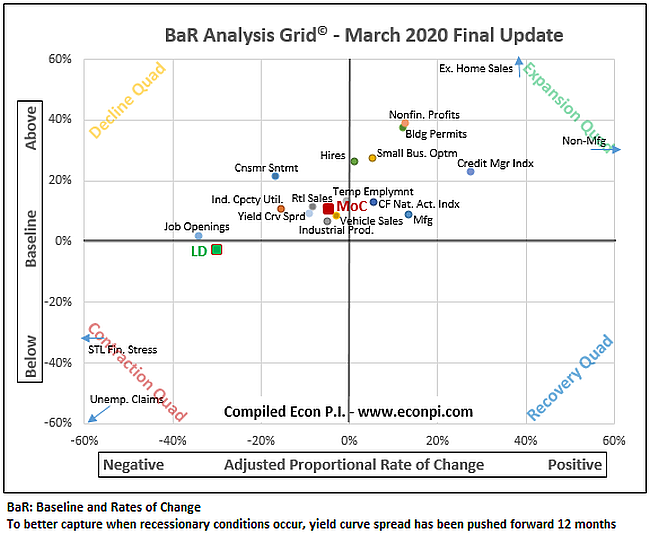
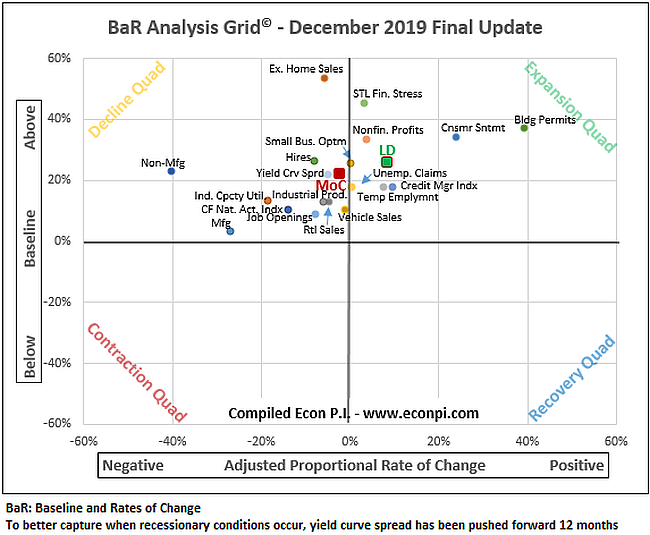
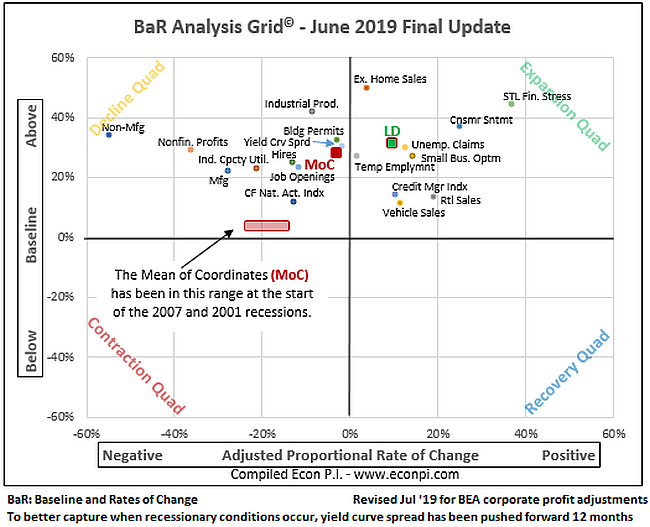
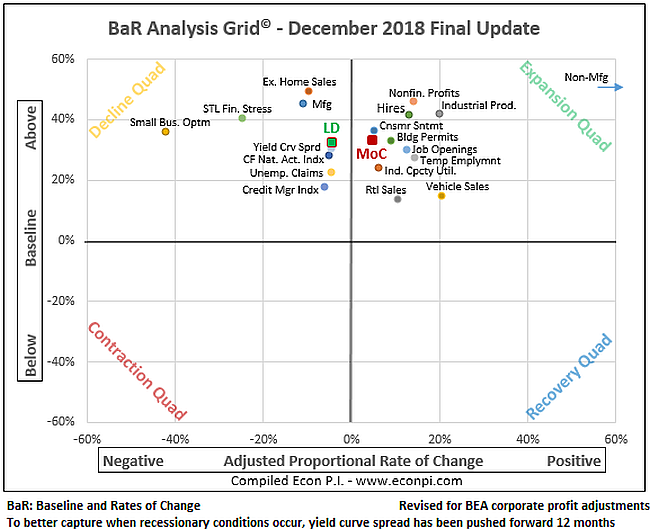
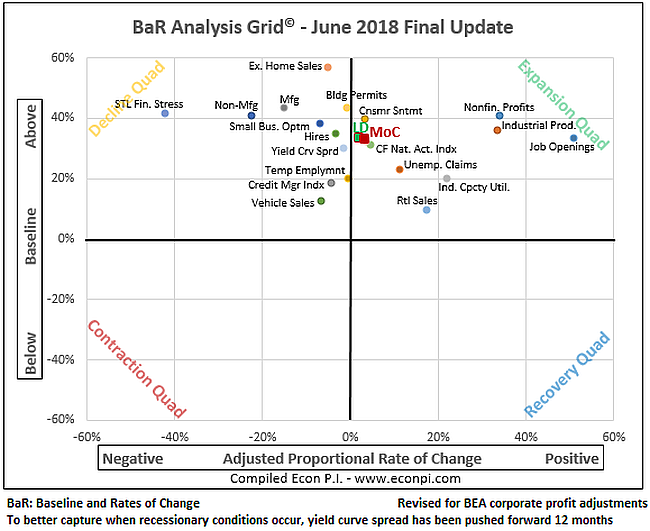
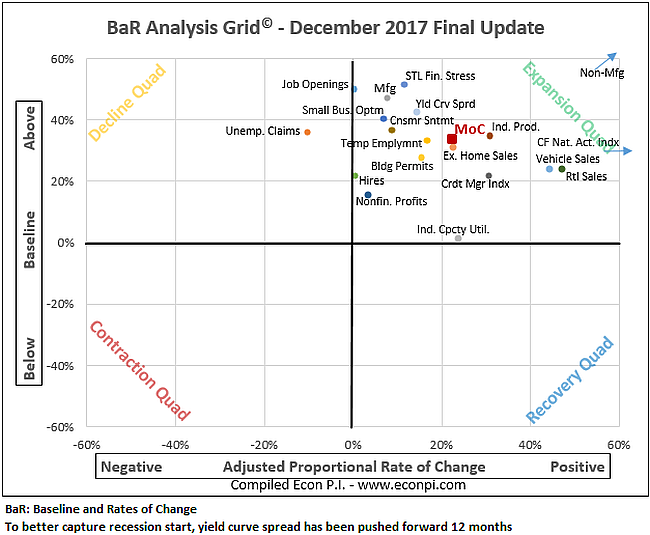
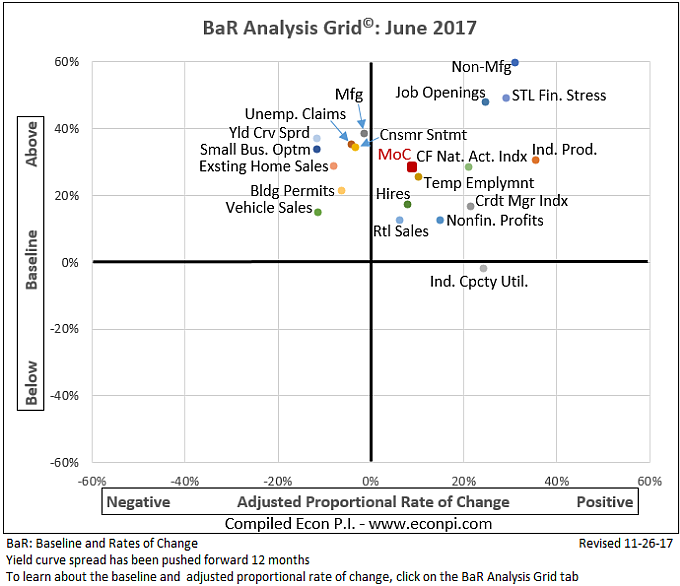
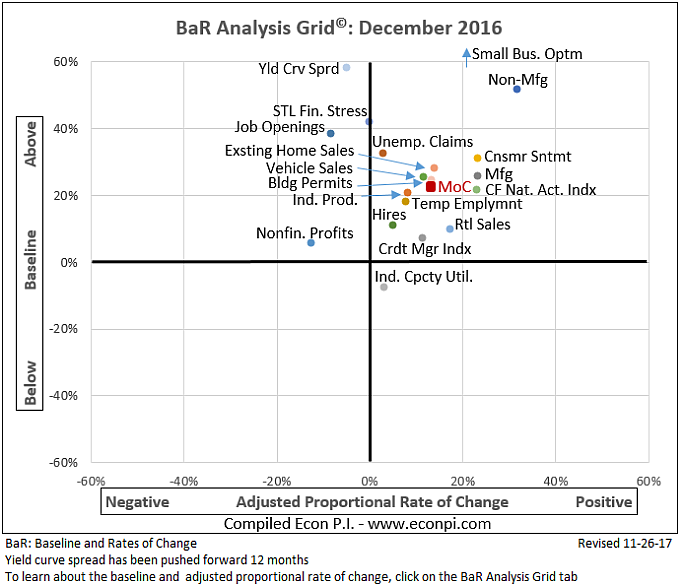
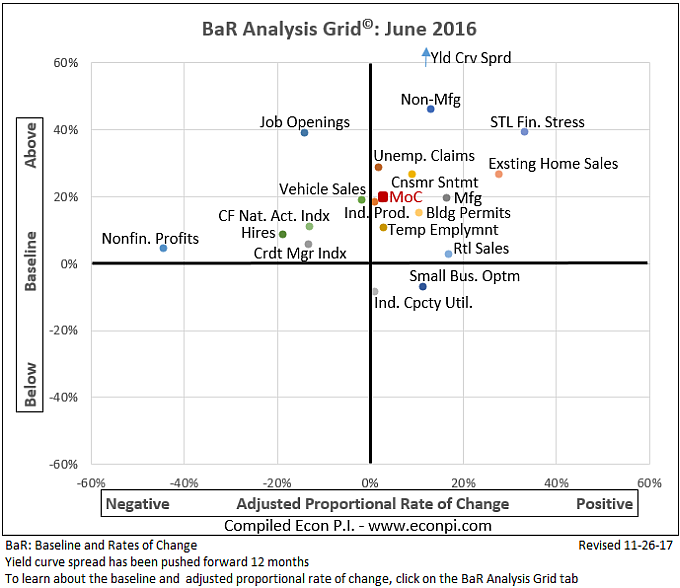
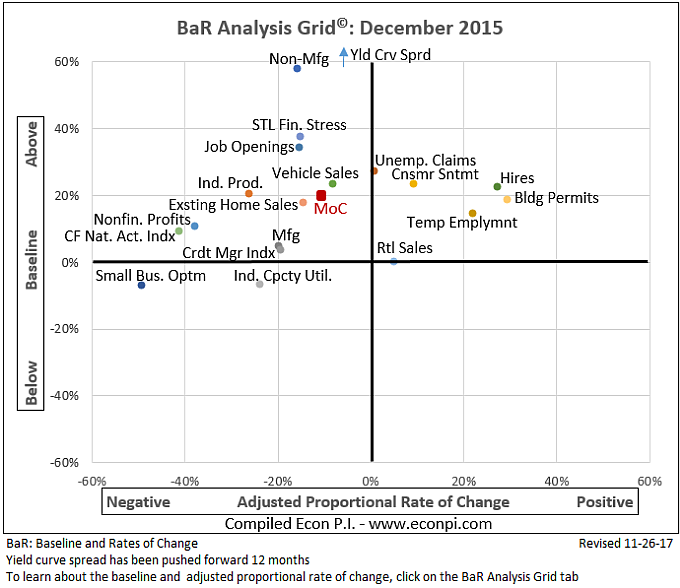
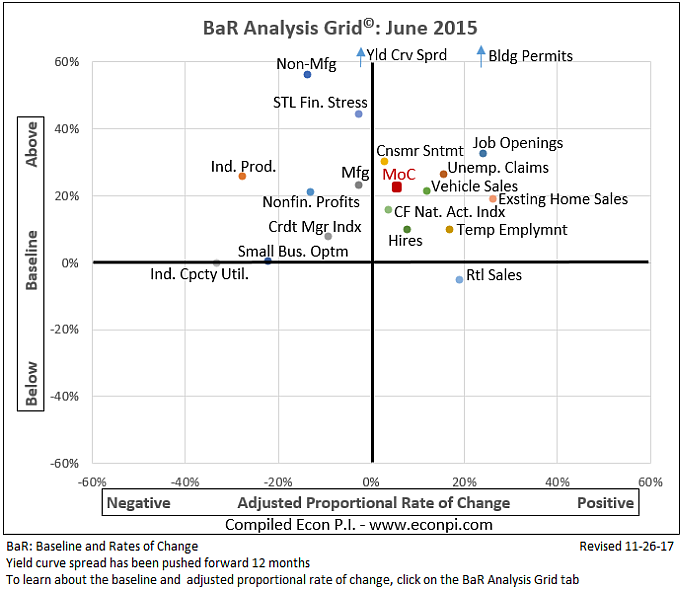
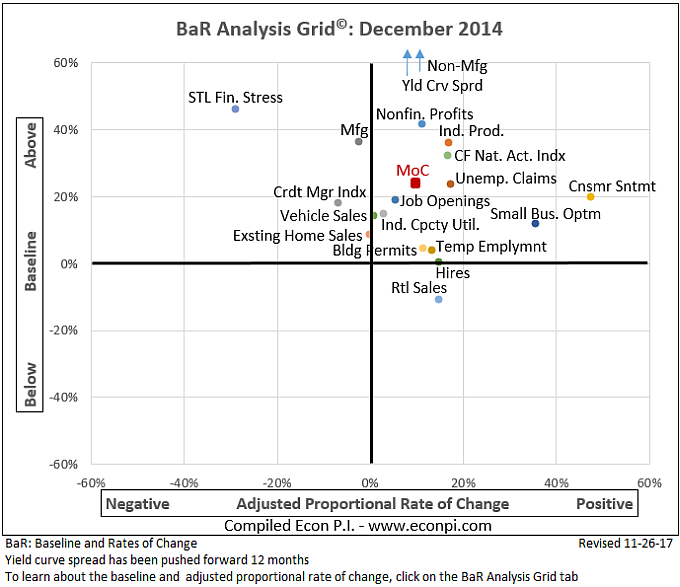
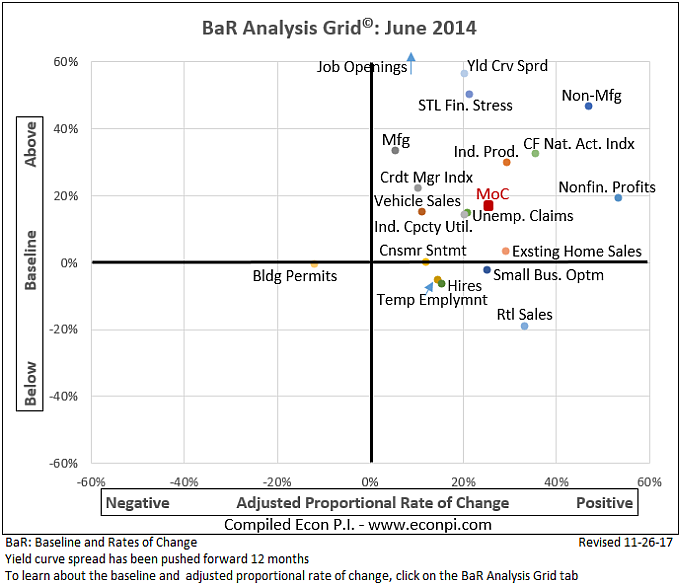
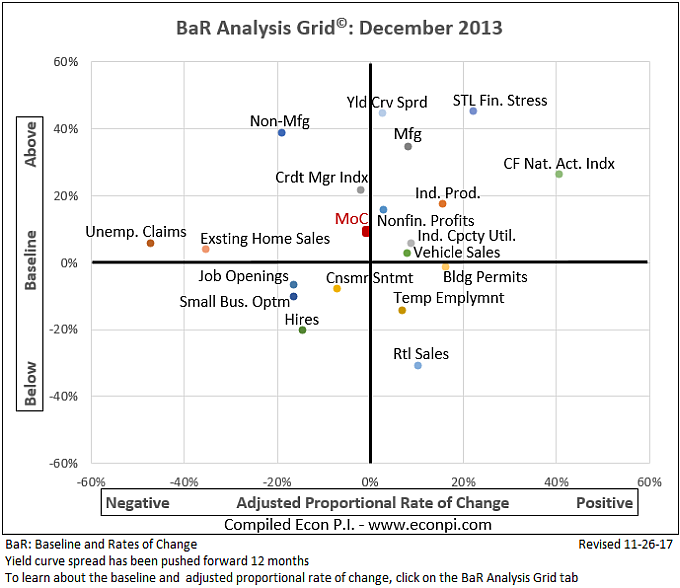
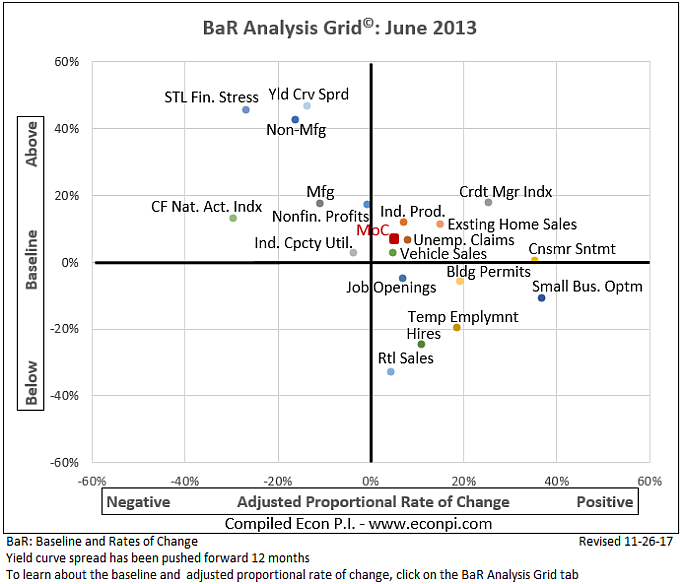
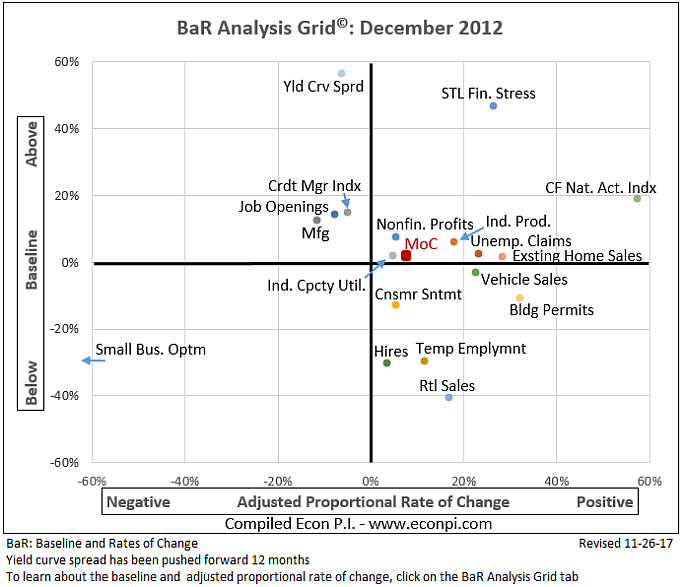
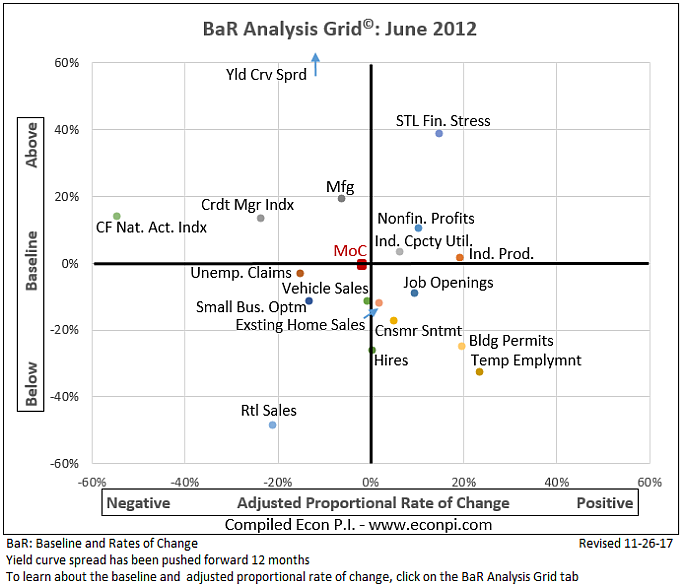
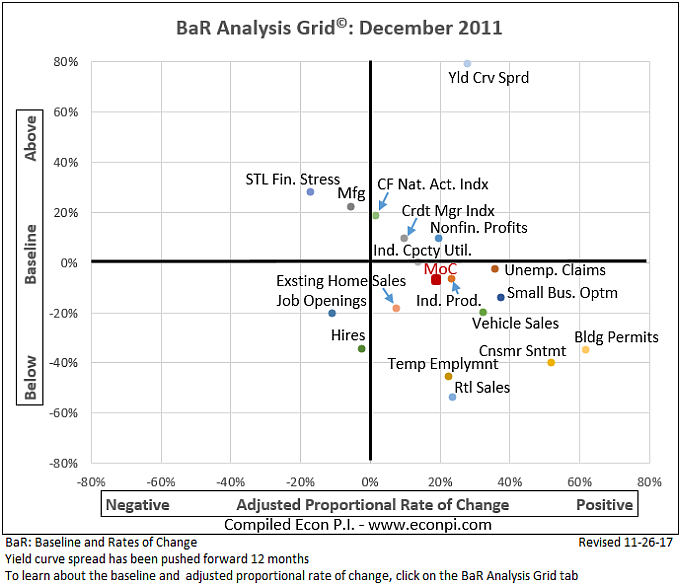
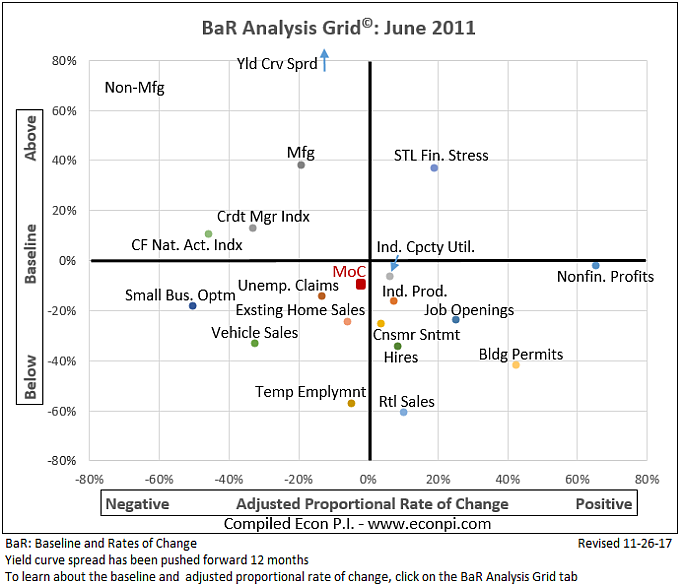
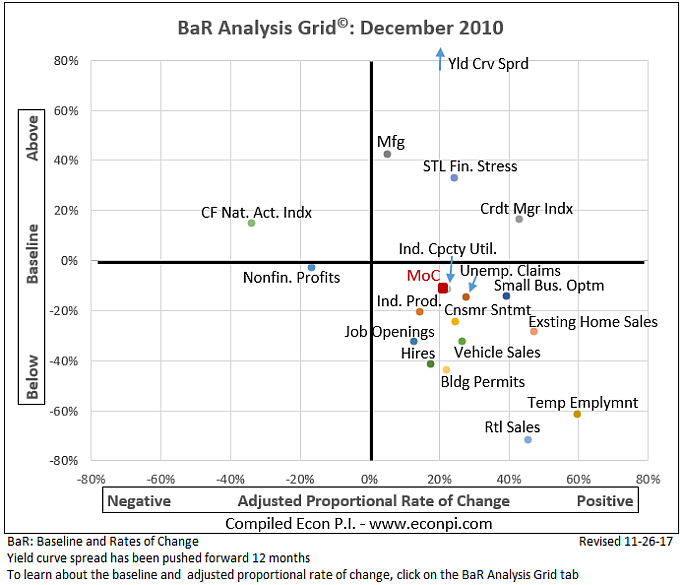
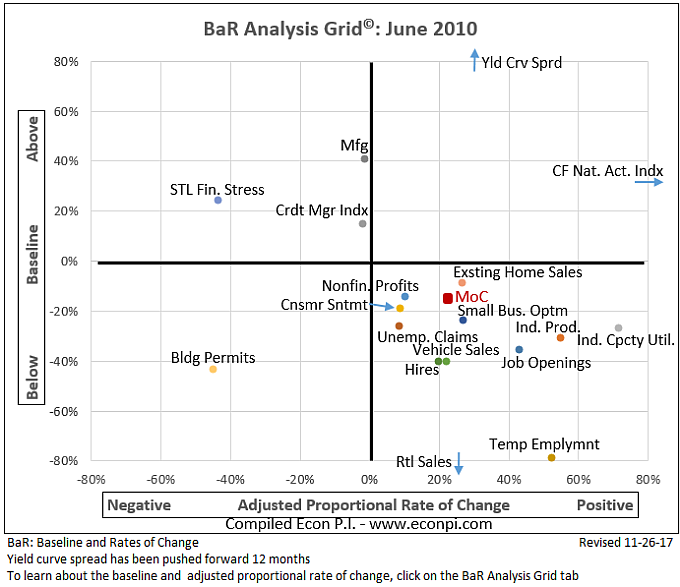
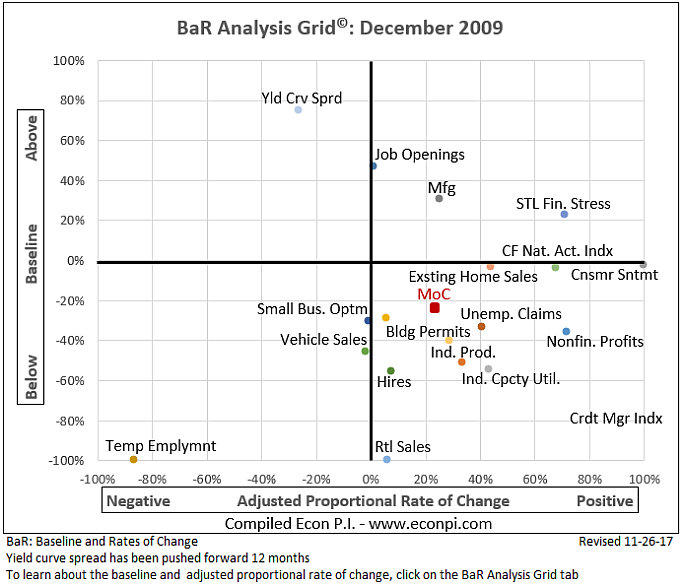
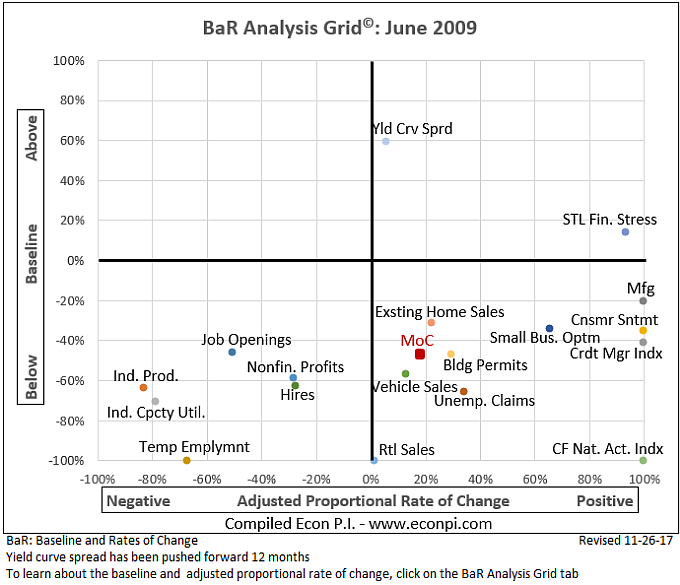
| The Baseline and Rate of Change (BaR) Analysis Grid© clarifies current economic conditions and signals how near the economy is to a recession. The mean of coordinates (MoC) indicates the overall health of the economy. Leading indicators (LD) are a subset of indicators that provide insight into emerging trends. Click here to learn how to read the BaR grid. The BaR is updated on Friday, providing weekly updates with the most recent economic data. |
|||||||||||||||||||||||||||||
| Copyright © 2017 - 2025 econpi.com All Rights Reserved | |||||||||||||||||||||||||||||
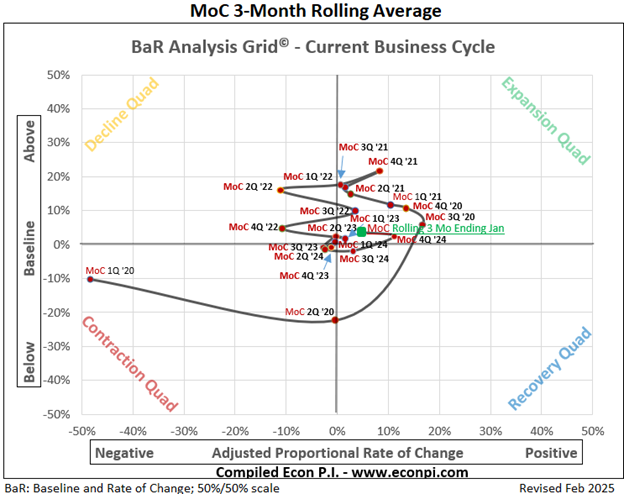
| Click on arrows to see how the current business cycle has progressed since 2009. |
|||||||||||||||||||||||||||||


|
|||||||||||||||||||||||||||||
Existing home salesU
|
|||||||||||||||||||||||||||||
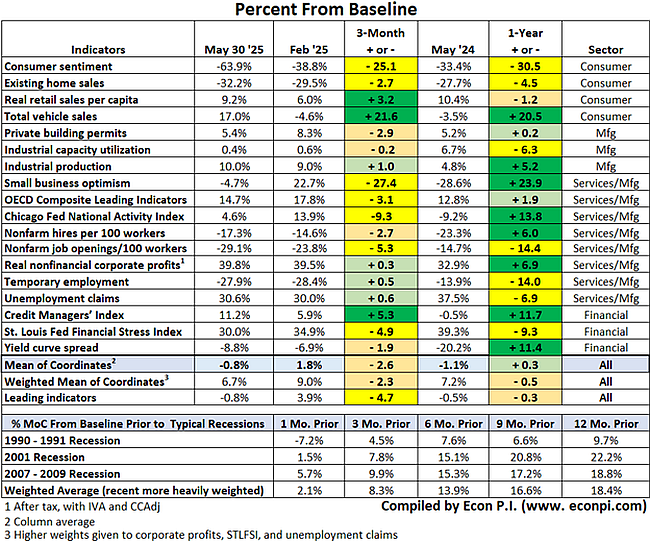
| Economic Indicators Percent from Baseline: 3-Month and 1-Year Trends |
|||||||||||||||||||||||||||||
| Updated 5/30. To see previous tables go here. Next update 6/6. |
|||||||||||||||||||||||||||||
 |
|||||||||||||||||||||||||||||
| Current Business Cycle Rolling 3-Month Average with reported data through January 2025; Updated 2/28/25 (See other business cycles) |
|||||||||||||||||||||||||||||
 |
|||||||||||||||||||||||||||||
 |
|||||||||||||||||||||||||||||
| The problem with putting two and two together is that sometimes you get four, and sometimes you get twenty-two.” ― Nick Charles, The Thin Man | |||||||||||||||||||||||||||||