econ p.i. logo

Quick, unbiased view of the economy...

"Insensibly one begins to twist facts to suit theories, instead of theories to suit facts."        — Sherlock Holmes, A Scandal in Bohemia

Economic Indicators

Economic Indicator Charts with Baselines

The BaR Analysis Grid© uses economic indicators that correlate strongly with the ups and downs of a business cycle and show a consistent pattern of decline prior to recessions. Indicators can be divided into two groups: static and dynamic. Static indicators, like the Chicago Fed National Activity Index and the St. Louis Fed Financial Stress Index, have a consistent recession signal range, resulting in baselines that are are the same from business cycle to business cycle. Other indicators, such as retail sales and building permits, are dynamic, meaning that the indicator values and baseline estimate change with each business cycle.

The recession baselines for dynamic economic indicators are based on the values seen when previous recessions have started. During a business cycle, after an indicator hits a peak value it will decline until a recession starts. The baseline is largely determined by how much an indicator normally decreases from peak to recession start in previous business cycles.

The charts shown below are snapshots taken in February 2022  
 
Building Permits
Dynamic baseline; leading indicator
Building Permits
 
Chicago Fed National Activity Index
 Static baseline
CFNAI

Consumer Sentiment
 Dynamic baseline; leading indicator
 Consumer Sentiment

Real Nonfinancial Corporate Profits
 Dynamic baseline
 Corporate Profits
 
Credit Managers' Index (National Association of Credit Managers)
Static baseline
CMI

Existing Home Sales (National Association of Realtors)
Dynamic baseline
Existing Home Sales

Industrial Production and Capacity Utilization
Dynamic baseline
Industrial Production

Job Openings and Hires
Dynamic baseline
Job Openings 

OECD Business Confidence Index

Dynamic baseline
Bus Cnfd

Real Retail Sales Per Capita
Dynamic baseline
Retail Sales 
 
Small Business Optimism (National Federation of Independent Business)
Dynamic baseline; leading indicator
Small Business

St. Louis Fed Financial Stress Index, Monthly Average
Static baseline; leading indicator
STLFSI

Temporary Employment
Dynamic baseline; leading indicator
Temporary Employment

Weekly Unemployment Claims, Monthly Average
Dynamic baseline; leading indicator
Unemployment

Vehicle Sales
Dynamic baseline, leading indicator
Vehicles Sales

Yield Curve Spread, Monthly Average (10-year Treasury notes minus 2-year Treasury notes)

Dynamic baseline, leading Indicator

Note: The yield cure spread is pushed forward 12 months when plotted on the BaR Analysis Grid. Research by the Cleveland Fed has determined that the yield curve forecasts economic growth approximately one year in advance. Go here to see the Cleveland Fed's yield curve spread forecast. However, the 12 months is an average and the actual time forecast differs for each business cycle.

Yield Curve
 

Road to Recession

Mapping the Road to Recession

Click on the arrows to see how the economy progressed towards the 2007 (top) and 2001 (bottom) recessions. The mean of coordinates (MoC) is the average of all plotted points. It signals the overall health of the economy. The leading indicator coordinates (LD) is the average of the eight leading indicators plotted on the BaR (see FAQ). Recessions occur when the MoC nears the baseline. 

2007 Recession


2001 Recession


Just the facts...

Current Economic Conditions
The Baseline and Rate of Change (BaR) Analysis Grid© clarifies current economic conditions and signals how near the economy is to a recession. The mean of coordinates (MoC) indicates the overall health of the economy. Leading indicators (LD) are a subset of indicators that provide insight into emerging trends. Click here to learn how to read the BaR grid. The BaR is updated on Friday, providing weekly updates with the most recent economic data.

Copyright © 2017 - 2024 econpi.com All Rights Reserved
Click on arrows to see how the current business cycle has progressed since 2009.
What is the WMoC? 
Next update will be on May 31.
  • 2024_5_10.png
  • 2024_5_3.png
  • 2024_4_26.png
  • 2024_4_19.png
  • 2024_4_12.png
  • 2024_4_5.png
  • 2024_3_29.png
  • 2024_3_22.png
  • 2024_3_15.png
  • 2024_3_8b.png
  • 2024_3_1.png
  • 2024_2_23.png
  • 2024_2_16.png
  • 2024_2_9.png
  • 2024_2_2.png
  • 2024_1_26.png
  • 2024_1_19.png
  • 2024_1_12.png
  • 2024_1_5.png
  • 2023_12_29_-_60.png
  • 2023_12_22_-_60.png
  • 2023_12_15_-_60.png
  • 2023_12_8_-_60_a.png
  • 2023_12_1_-_60.png
  • 2023_11_22_-_60_a.png
  • 2023_11_17_-_60.png
  • 2023_11_10_-_60.png
  • 2023_11_3_-_60.png
  • 2023_10_27_-_60.png
  • 2023_10_20_-_60.png
  • 2023_10_13_-_60.png
  • 2023_10_6_-_60.png
  • 2023_9_29_-_60_b.png
  • 2023_9_22_-_60.png
  • 2023_9_15_-_60.png
  • 2023_9_8_-_60.png
  • 2023_9_1_-_60.png
  • 2023_8_25_-_60.png
  • 2023_8_18_-_60.png
  • 2023_8_11_-_60.png
  • 2023_8_4_-_60.png
  • 2023_7_28_-_60.png
  • 2023_7_21_-_60.png
  • 2023_7_14_-_60.png
  • 2023_7_7_-_60.png
  • 2023_6_30_-_60.png
  • 2023_6_23_-_60.png
  • 2023_6_16_-_60.png
  • 2023_6_9_-_60.png
  • 2023_6_2_-_60.png
  • 2023_5_26_-_60.png
  • 2023_5_19_-_60.png
  • 2023_5_12_-_60.png
  • 2023_5_5_-_60.png
  • 2023_4_28_-_100_b.png
  • 2023_4_21_-_100.png
  • 2023_4_14_-_100.png
  • 2023_4_7_-_100.png
  • 2023_3_31_-_100.png
  • 2023_3_24_-_100.png
  • 2023_3_17_-_100.png
  • 2023_3_10_-_100.png
  • 2023_3_3_-_100.png
  • 2023_2_24_-_100.png
  • 2023_2_17_-_100.png
  • 2023_2_10_-_100.png
  • 2023_2_3_-_100_a.png
  • 2023_1_27_-_100.png
  • 2023_1_20_-_100.png
  • 2023_1_13_-_100.png
  • 2023_1_6_-_100.png
  • 2022_12_23_100.png
  • 2022_11_25_100.png
  • 2022_10-28_100a.png
  • 2022_9-30_100.png
  • 2022_8-26_100.png
  • 2022_7-29_100_2.png
  • 2022_6_24-_100.png
  • 2022_5_27_-_100.png
  • 2022_4_29_-_100.png
  • 2022_3_25_-_100.png
  • 2022_2_25_-_100.png
  • 2022_1_28-_100.png
  • 2021_12_24_-_100.png
  • 2021_11_26_-_100.png
  • 2021_10_29_-_100.png
  • 2021_9_30_-_100.png
  • 2021_8_27-_100.png
  • 2021_7_30_-_100.png
  • 2021_6_25_-_100.png
  • 2021_5_28_-_100.png
  • 2021_4_30_-_100.png
  • 2021_3_26_-_100.png
  • 2021_2_26-_100.png
  • 2021_1_29_-_100.png
  • 2020_12_31_-_100.png
  • 2020_9__24_-_100_Final_a.png
  • 2020_8_28-_100__Final_revised.png
  • 2020_7_31_-_100_Final.png
  • 2020_6__26_-_100_Final.png
  • 2020_5_29_-_100_Final.png
  • 2020_4_29__-_100_Final.png
  • 2020-3-27-Final.png
  • 2019-12-27-Final.png
  • 2019-6-28-Final-Revised-BEA.png
  • 2018-12-28-Final-Revised-BEA.png
  • 2018-6-29-Final-Revised-BEA.png
  • 2017-12-30-Final-No-LD.png
  • 2017-6.png
  • 2016-12.png
  • 2016-6.png
  • 2015-12.png
  • 2015-6.png
  • 2014-12.png
  • 2014-6.png
  • 2013-12.png
  • 2013-6.png
  • 2012-12.png
  • 2012-6.png
  • 2011-12.png
  • 2011-6.png
  • 2010-12.png
  • 2010-6.png
  • 2009-12.png
  • 2009-6.png

May 10 update: For indicators updated this week, the changes in their baseline positions over the past three months are shown below. (Scroll down to see Percent from Baseline table.) 

 Indicator  
May 10, 2024
 % from Baseline  
 February 2024
 % from Baseline  
 
  + or - 
 
Total vehicle sales - 3.5% - 13.1% + 9.6
Weekly unemployment claims 33.6% 43.3% - 9.7
St. Louis Fed Financial Stress Index 36.6% 36.8% - 0.2
University of Michigan Consumer Sentiment Index - 33.4% - 8.9% - 24.5
MoC - 0.8% - 0.4% - 0.4
WMoC 7.9% 8.0% - 0.1
*Weekly unemployment claims are inverted on the BaR. A positive % change indicates a decrease in claims. 
(For better clarity, the BaR is now shown on a 60%/60% scale.)
Economic Indicators
Percent from Baseline: 3-Month and 1-Year Trends
Updated 5/10. To see previous tables go here. Next update 5/31.
Aug Mid 2020
Current Business Cycle
Rolling 3-Month Average with reported data through March 2024; Updated 4/30/24 
(See other business cycles)
2020 30 Month 2020 3Q 1
Grid Abbreviations June 2020
The problem with putting two and two together is that sometimes you get four, and sometimes you get twenty-two.” ― Nick Charles, The Thin Man

BaR Analysis Grid


Baseline and Rate of Change (BaR) Analysis Grid©

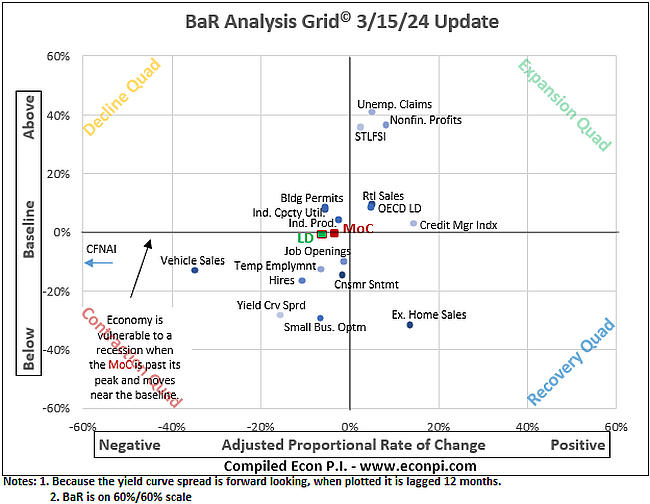
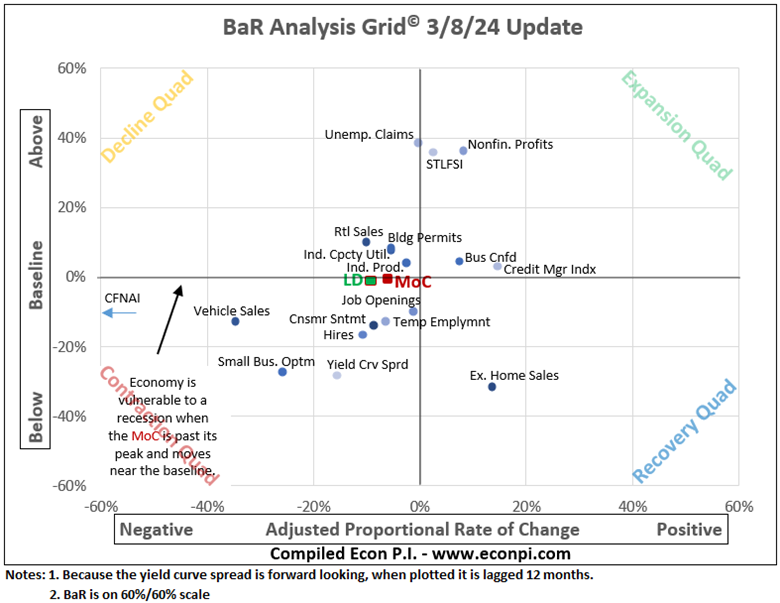
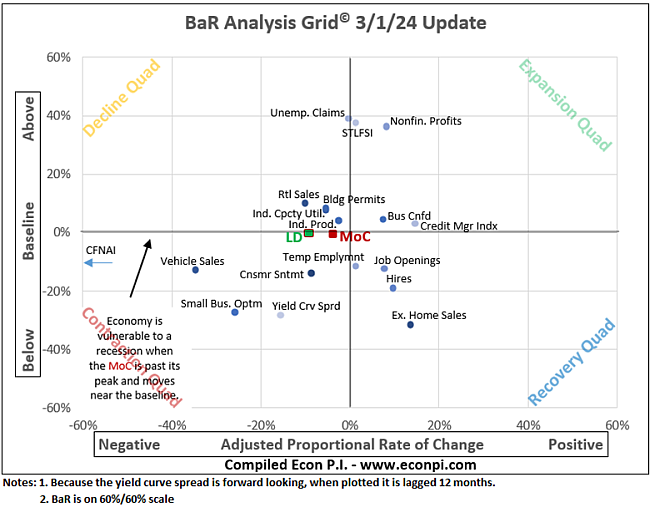
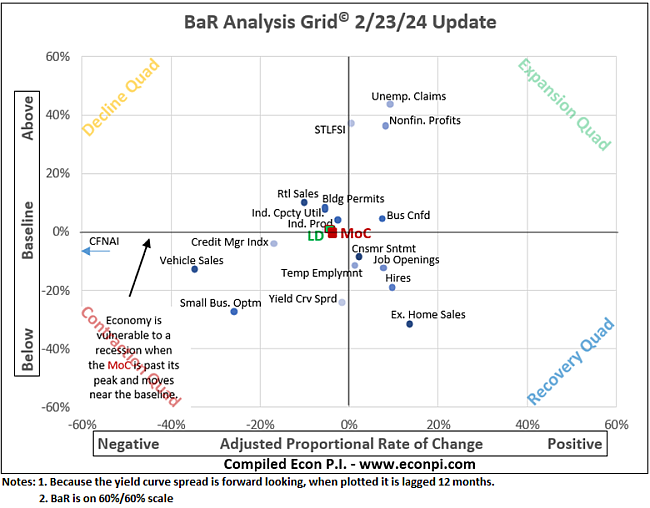
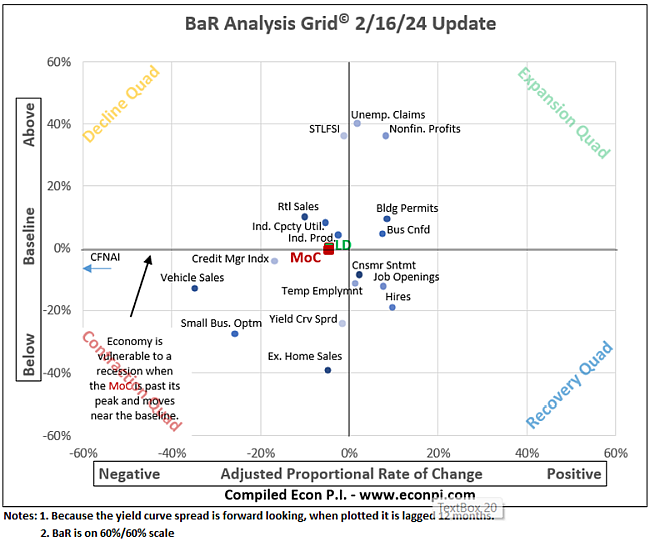
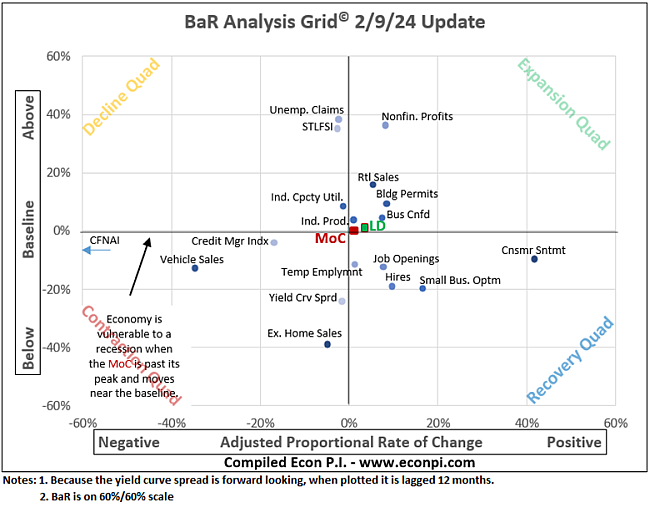
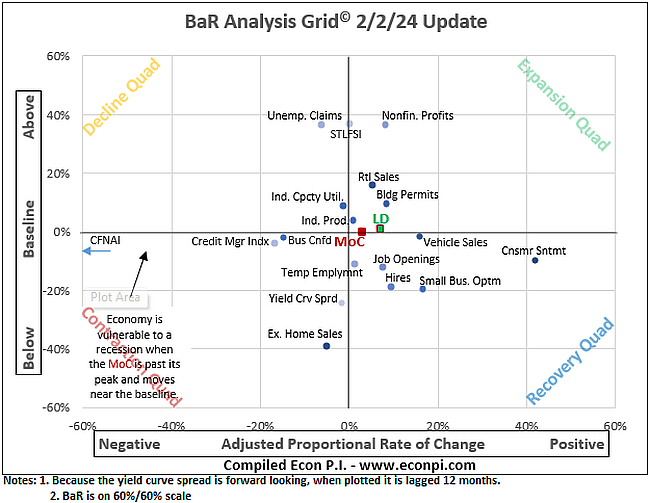
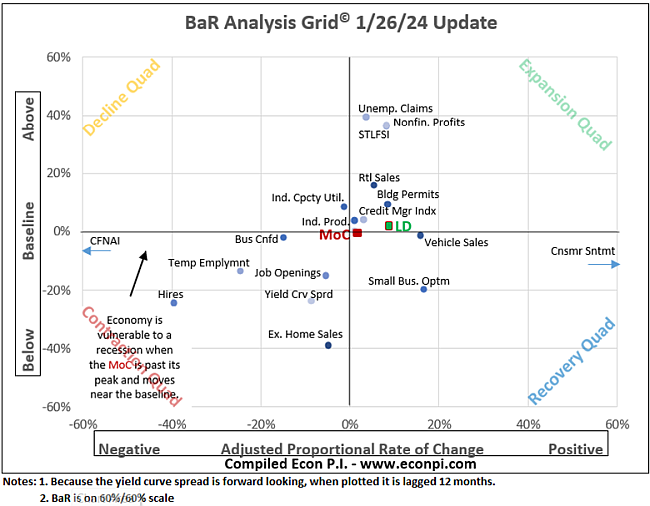
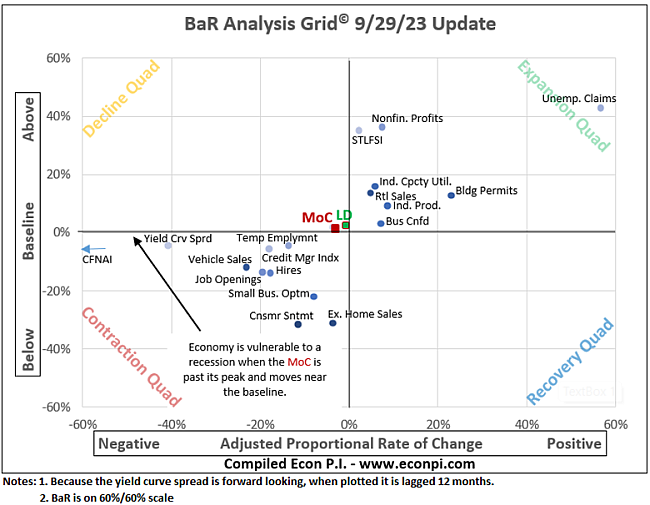
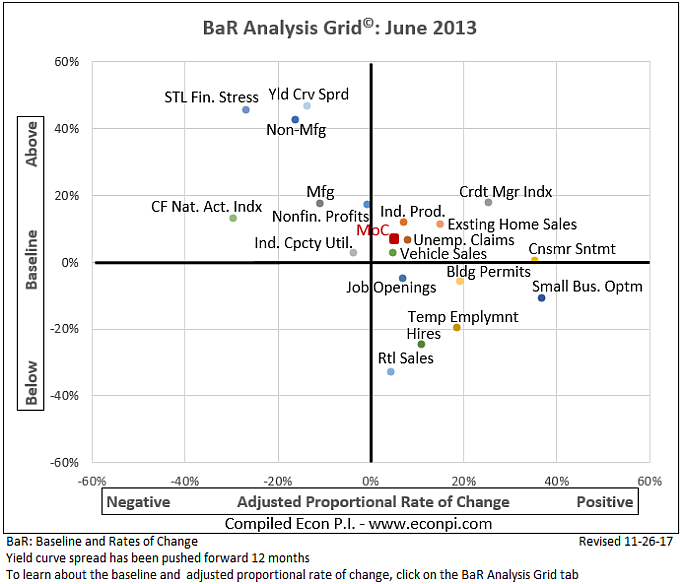
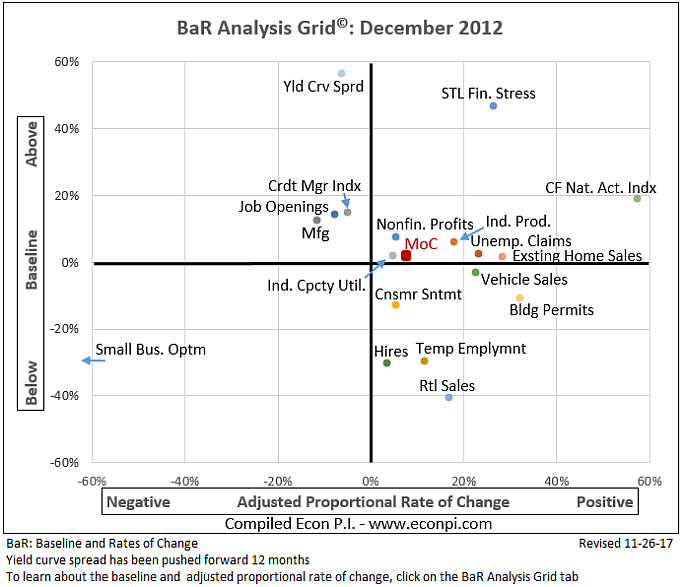
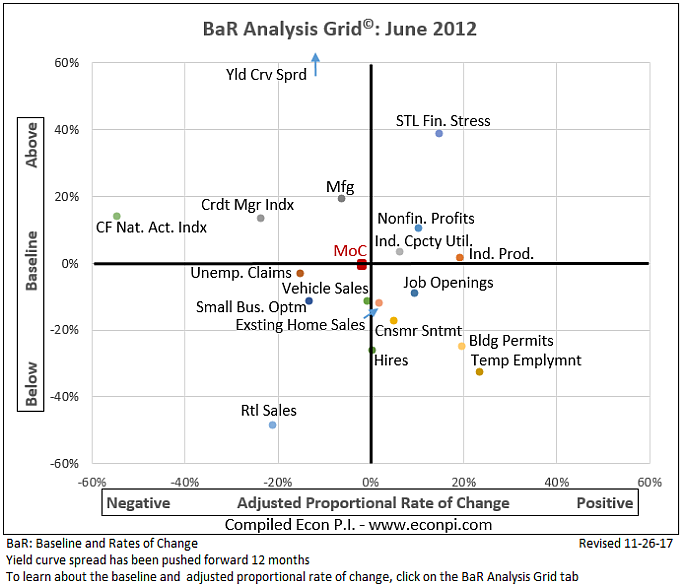
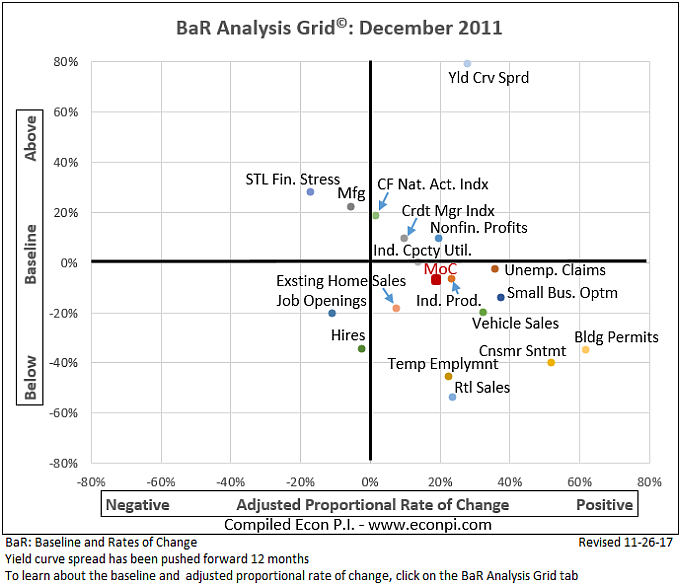
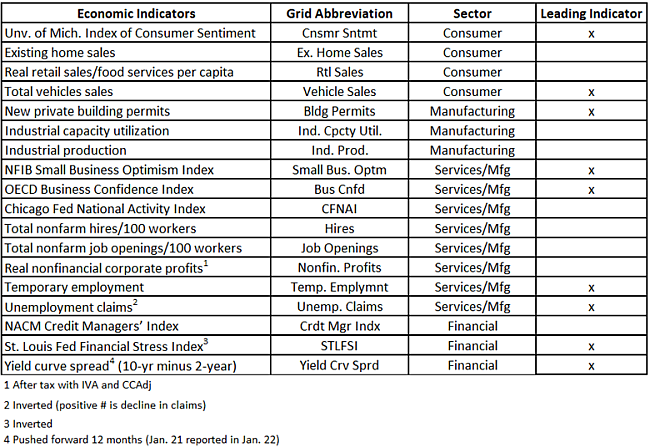
By plotting 18 key economic indicators, the BaR captures economic activity, sentiment, and outlook at a given period of time
. The BaR:   

  • Arranges data in a meaningful, understandable pattern. 
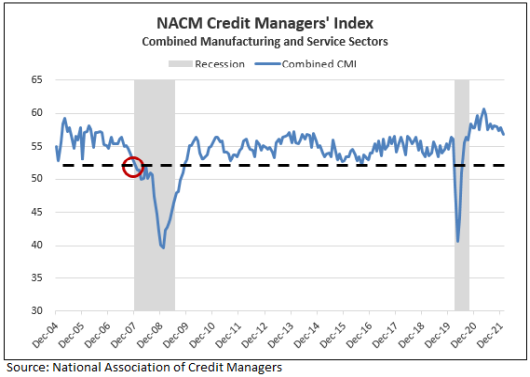
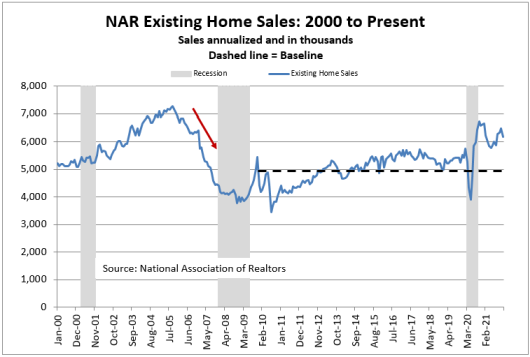
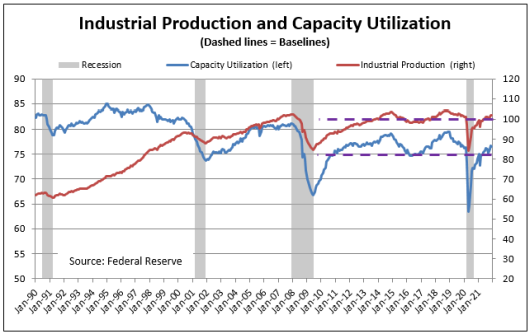
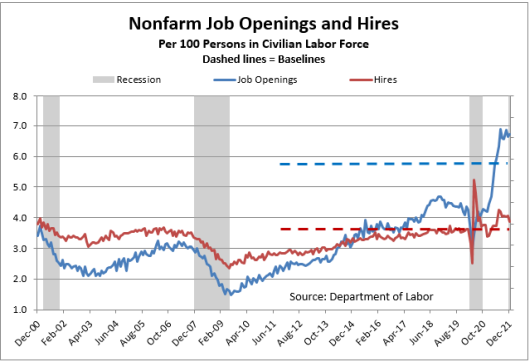
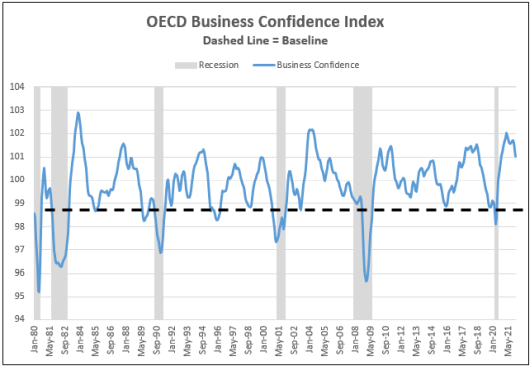
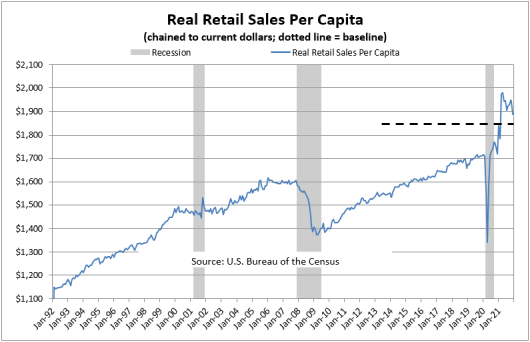
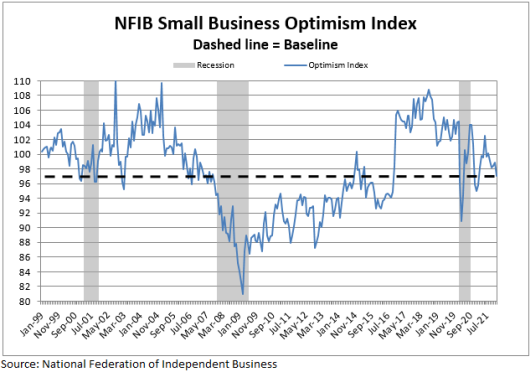
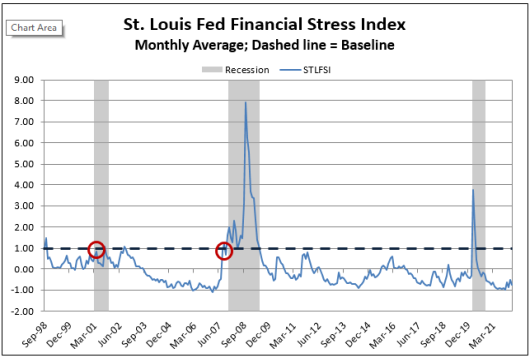
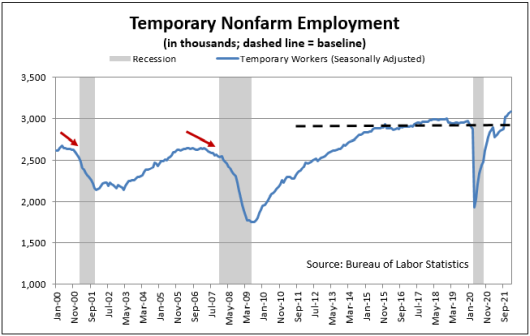
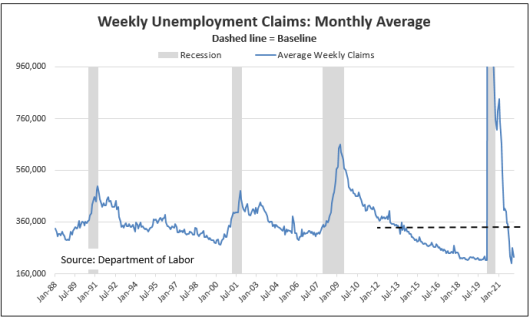
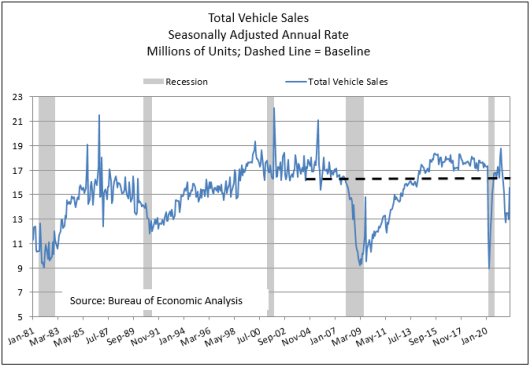
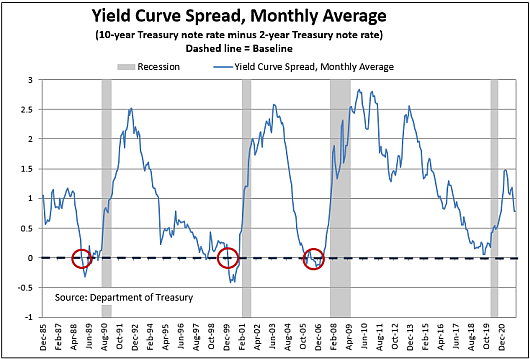
  • Sets a baseline that is an estimation of where each indicator is likely to be when a recession hits. Charts of the indicators and their baselines are shown here. 
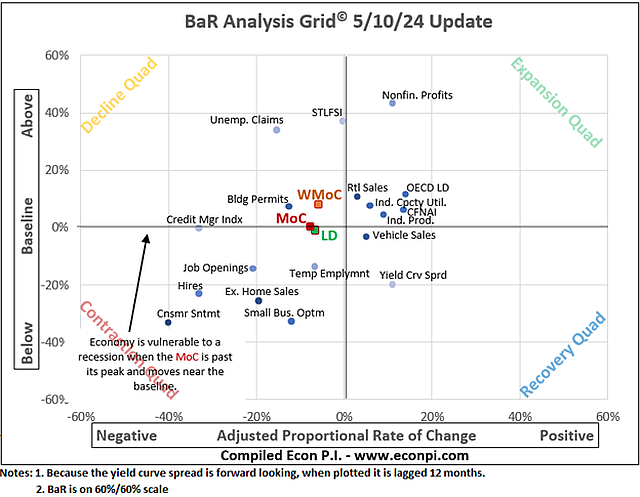
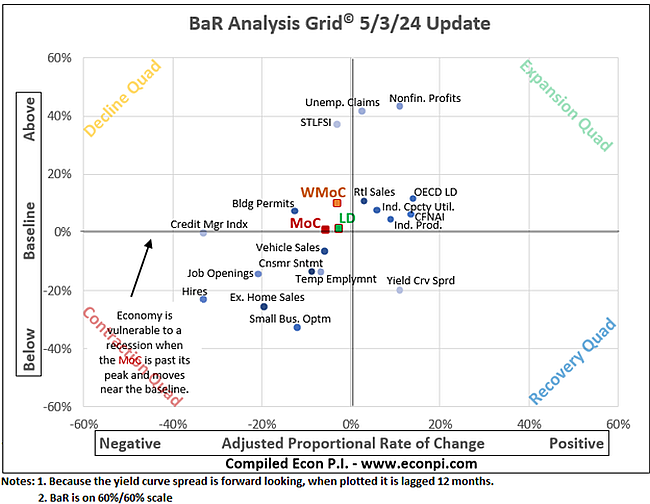
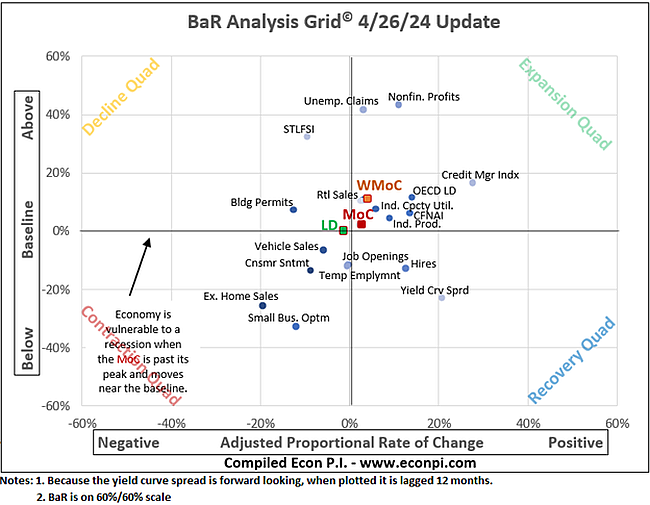
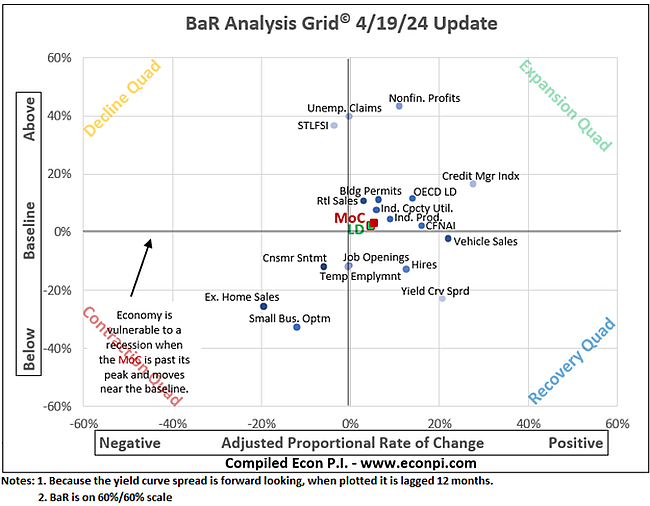
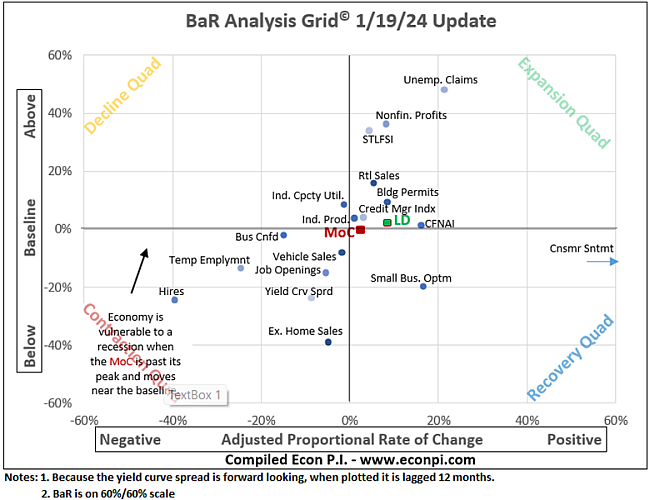
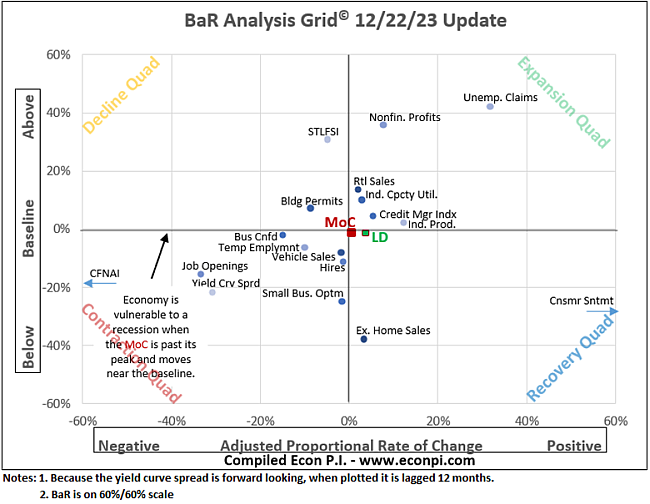
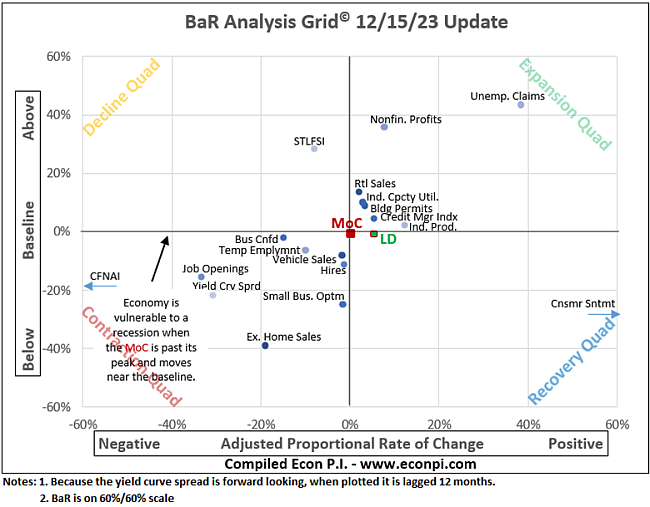
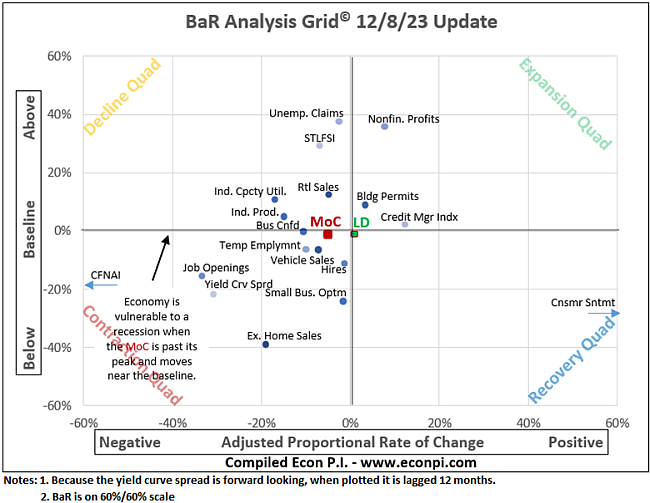
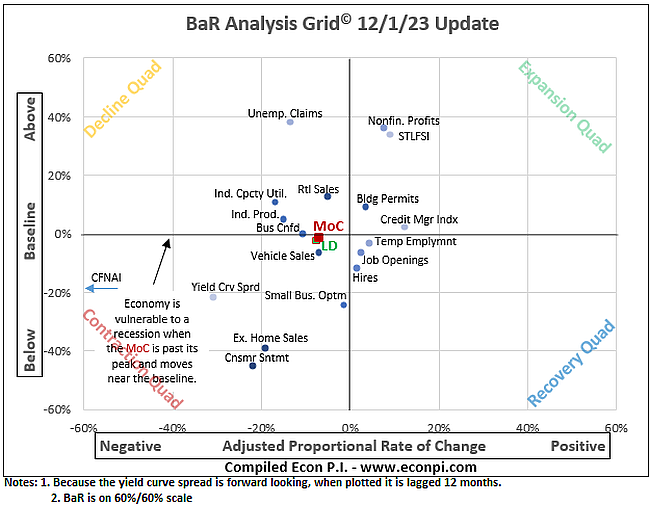
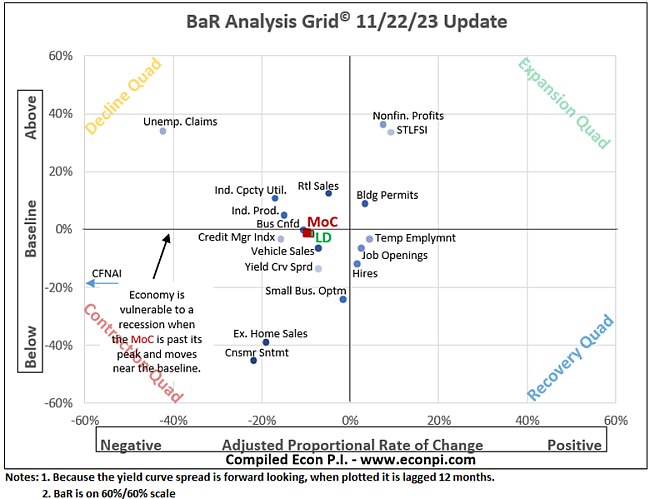
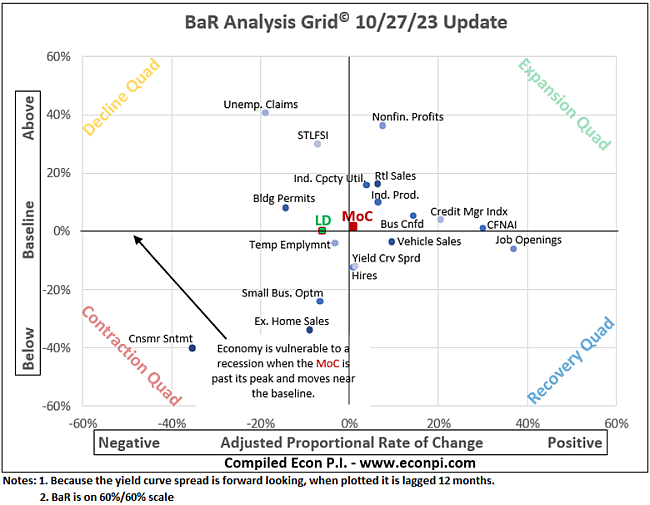
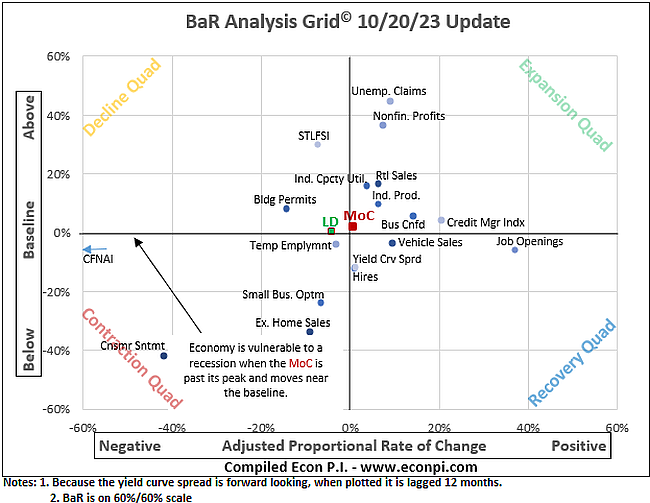
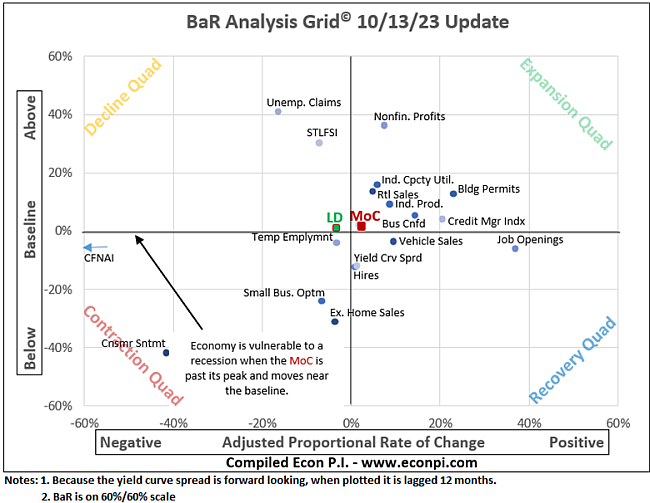
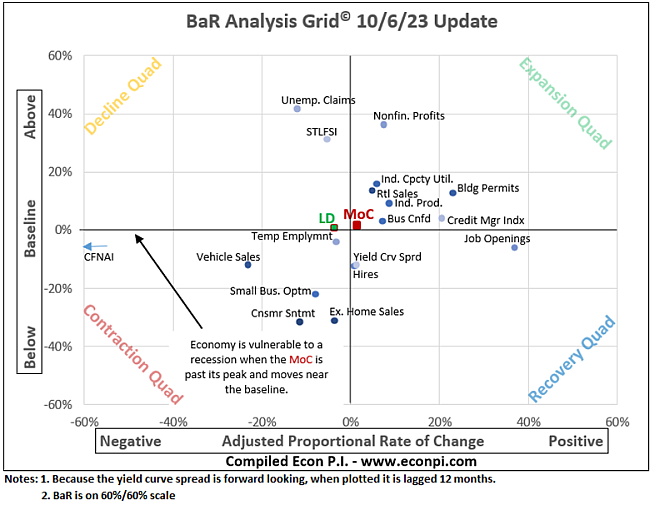
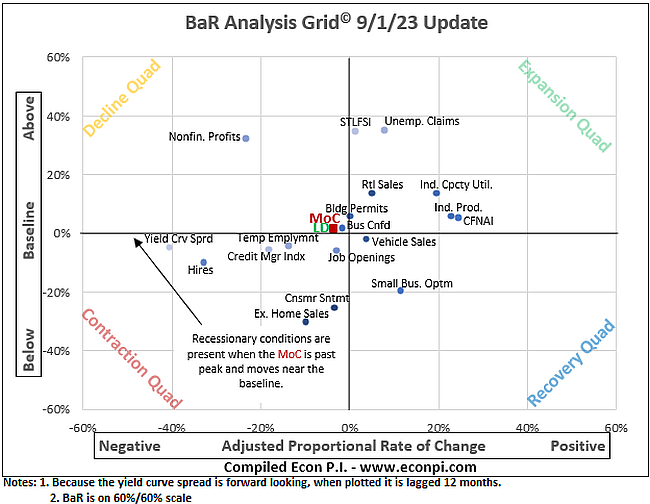
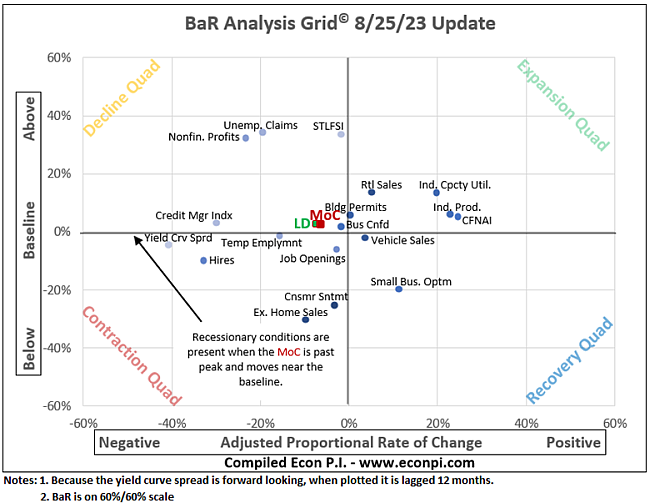
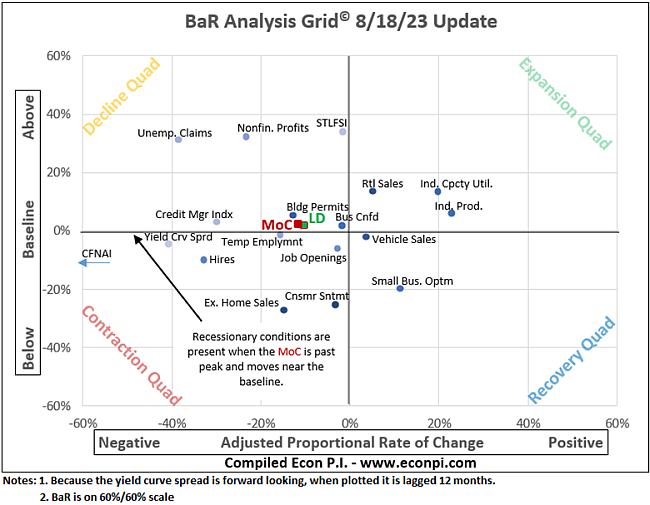
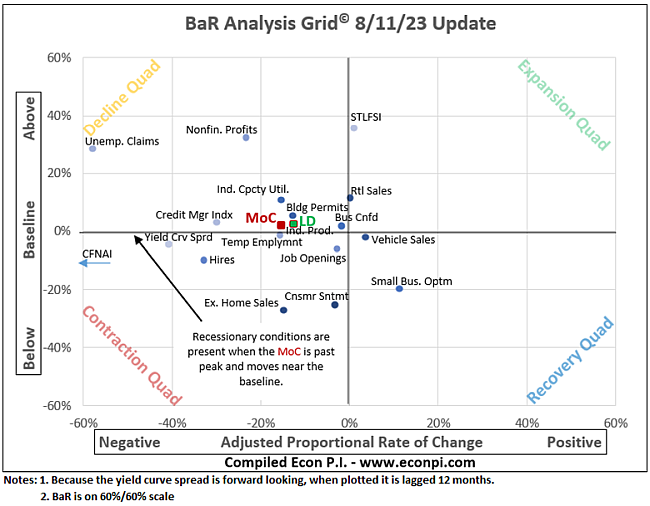
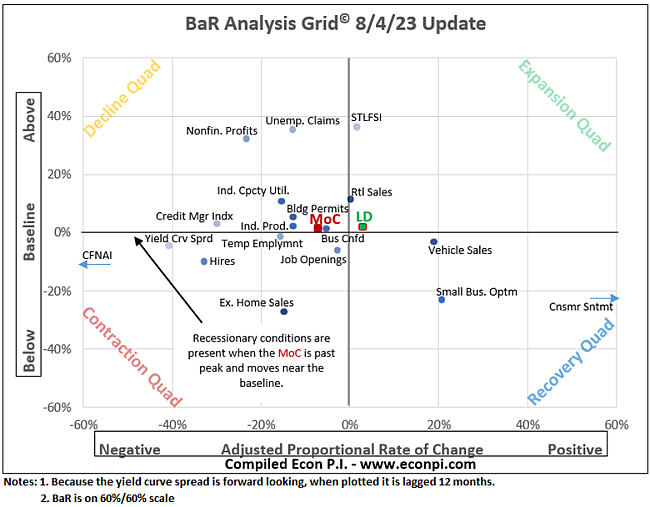
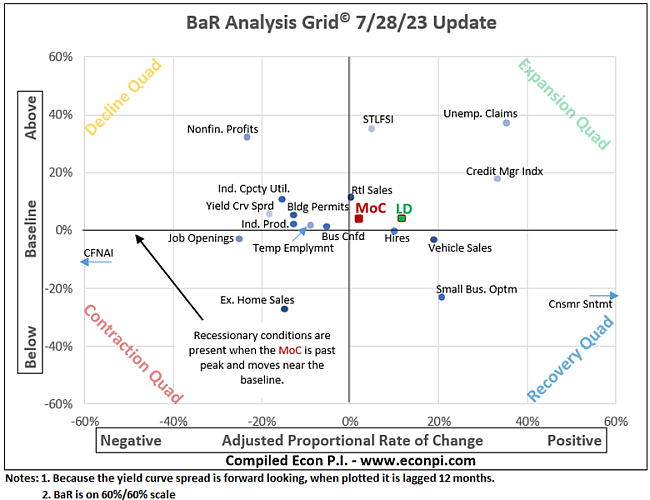
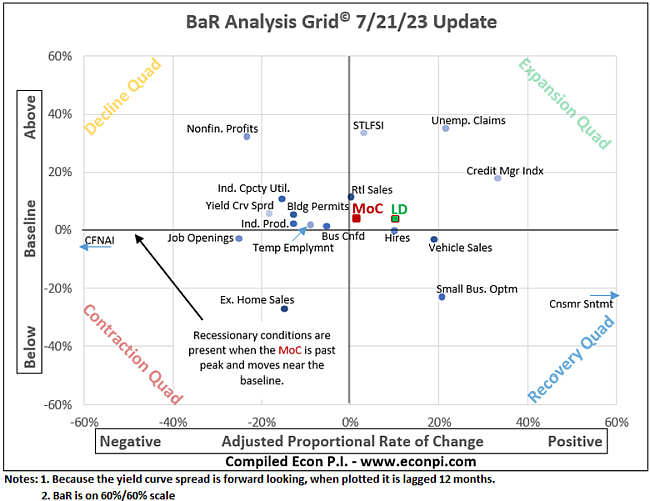
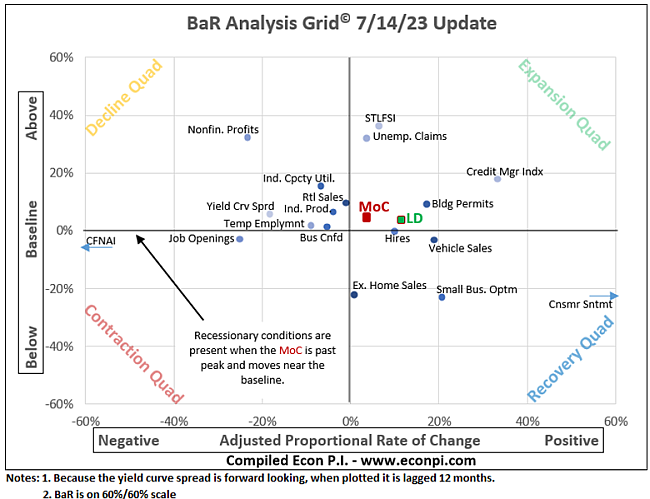
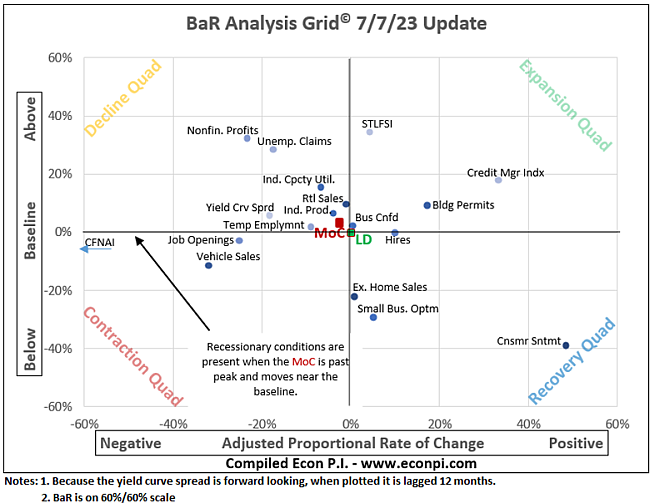
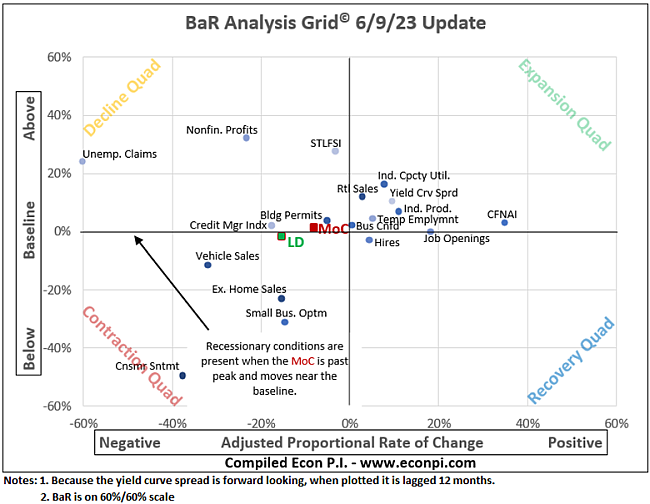
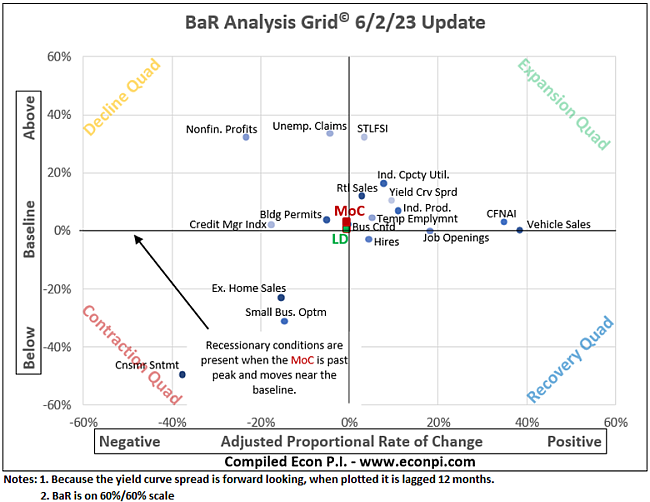
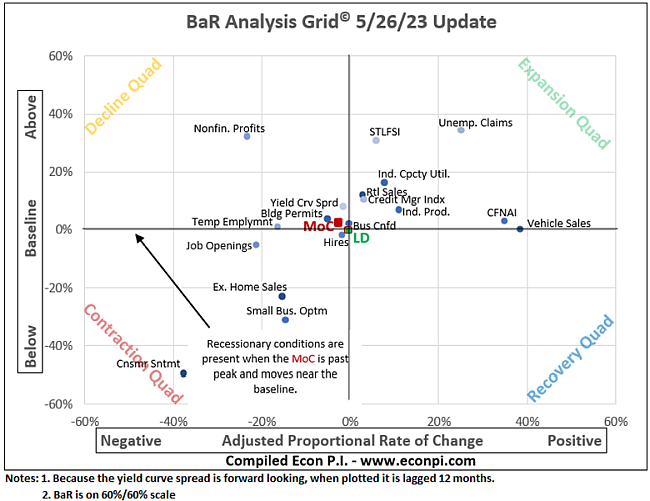
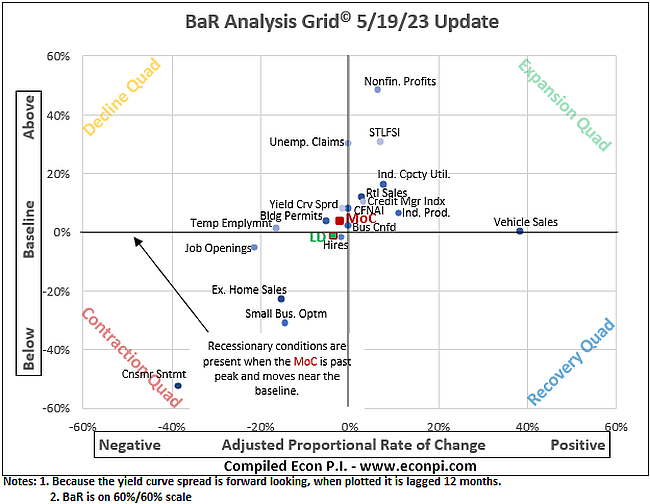
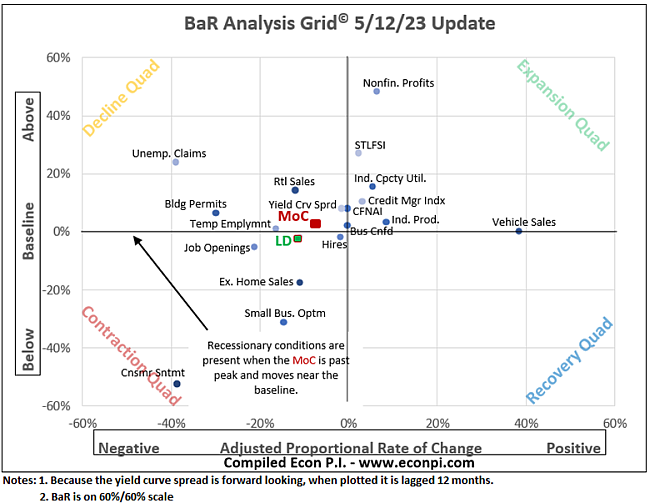
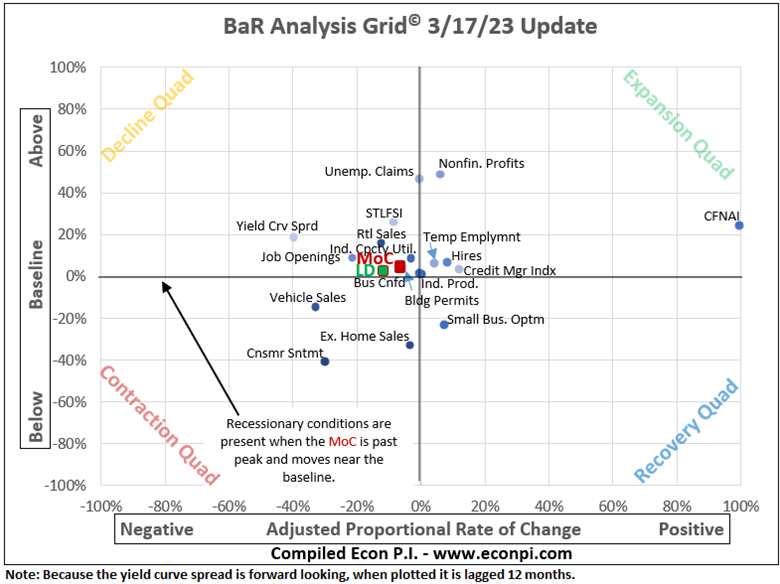
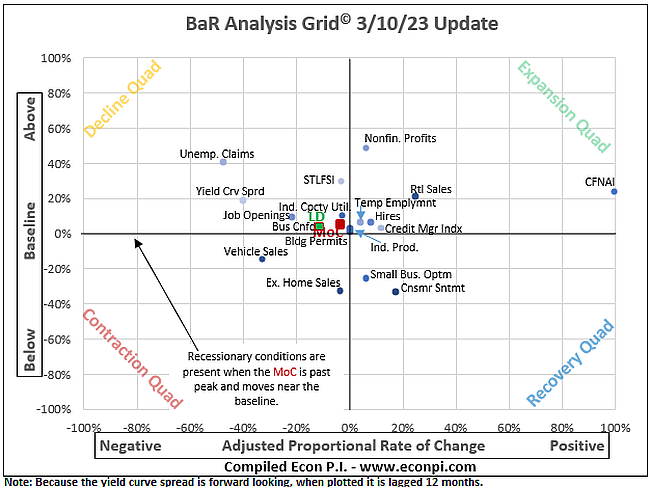
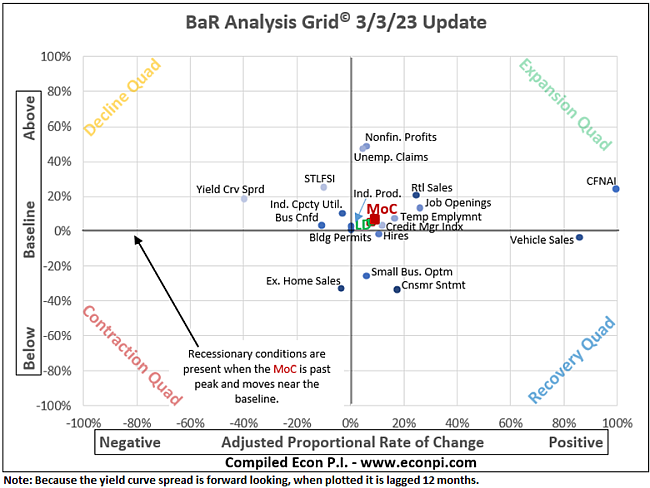
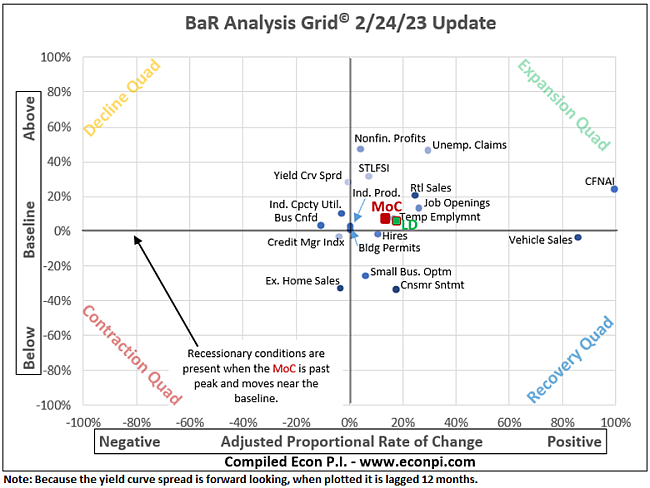
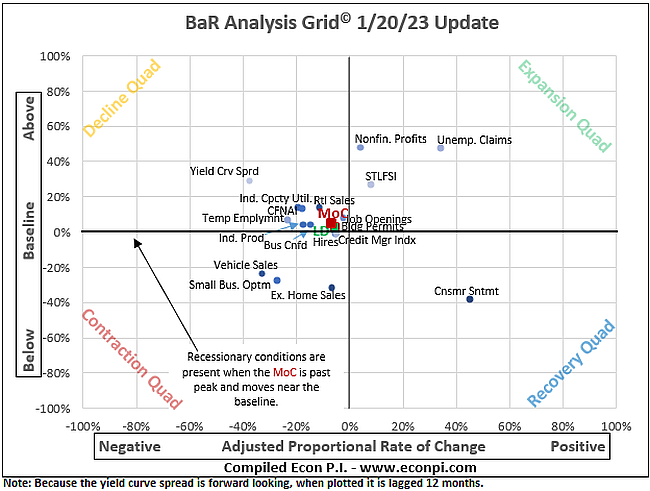
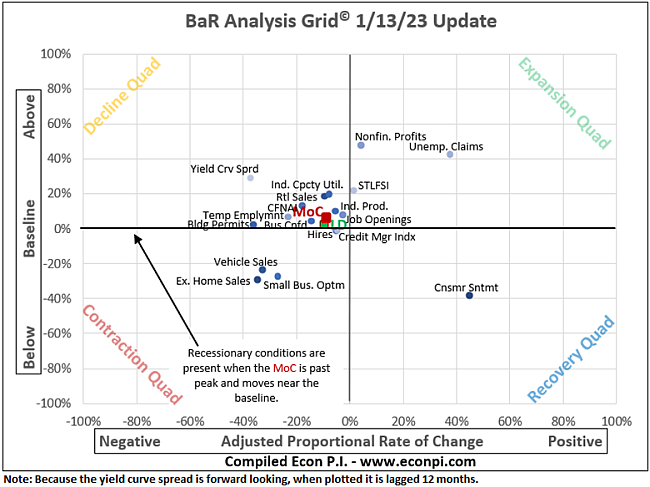
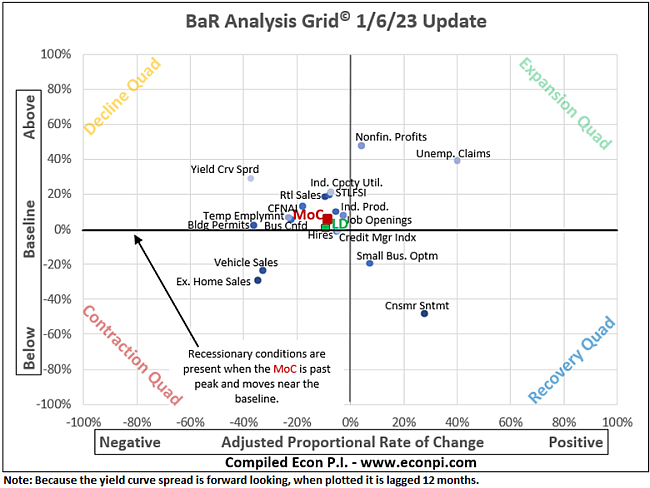
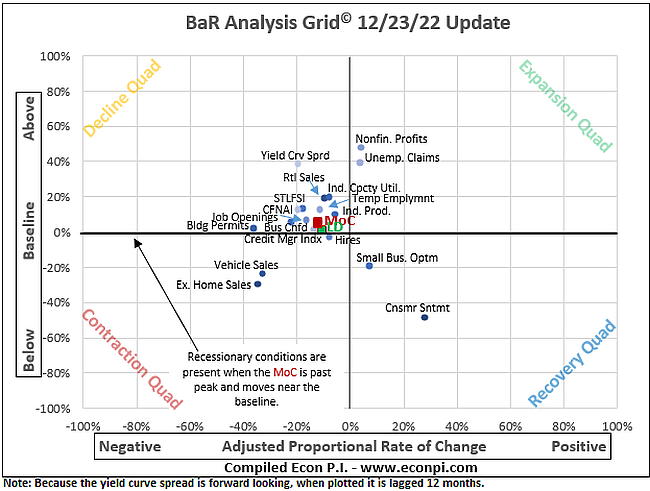
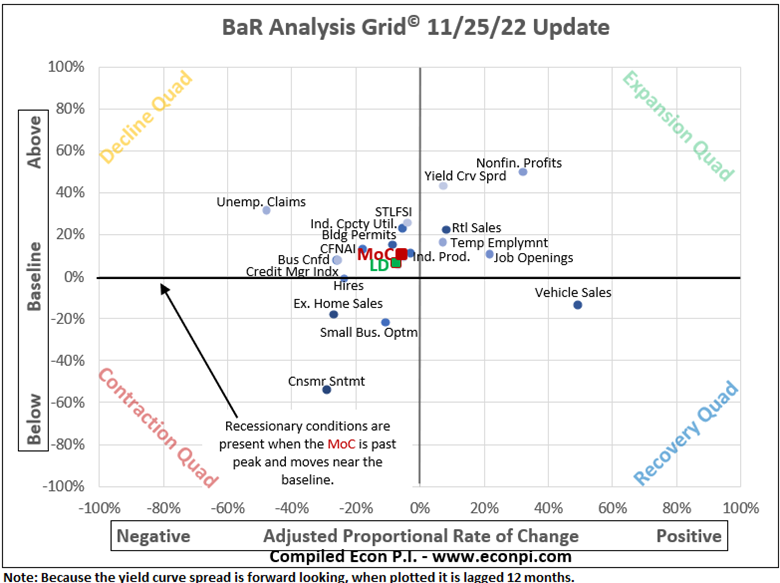
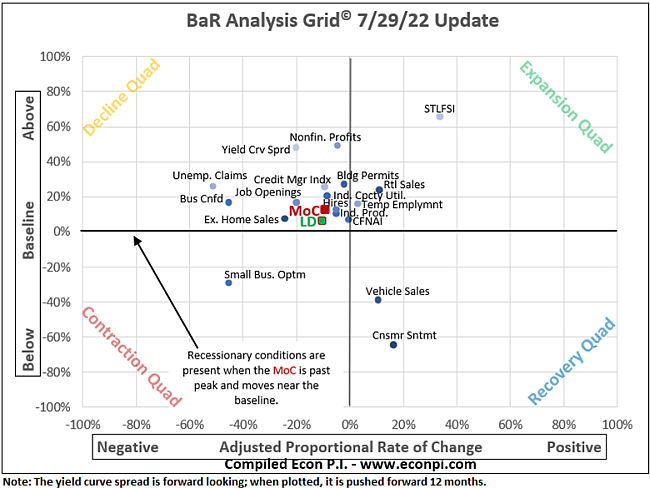
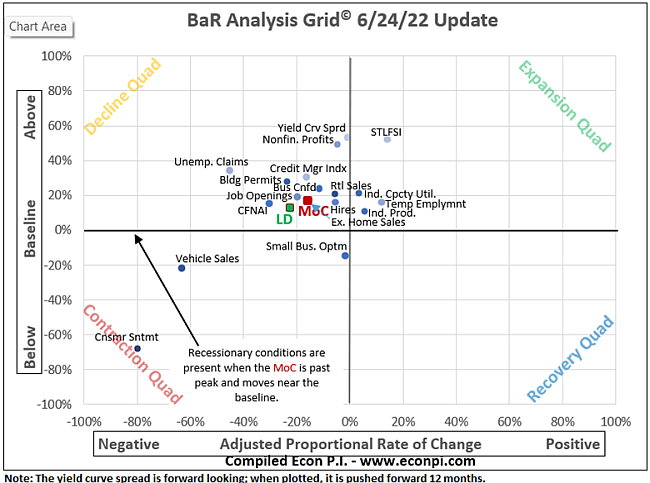
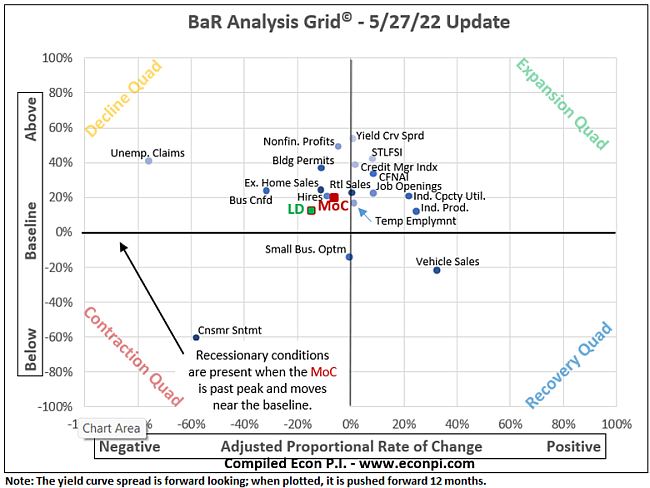
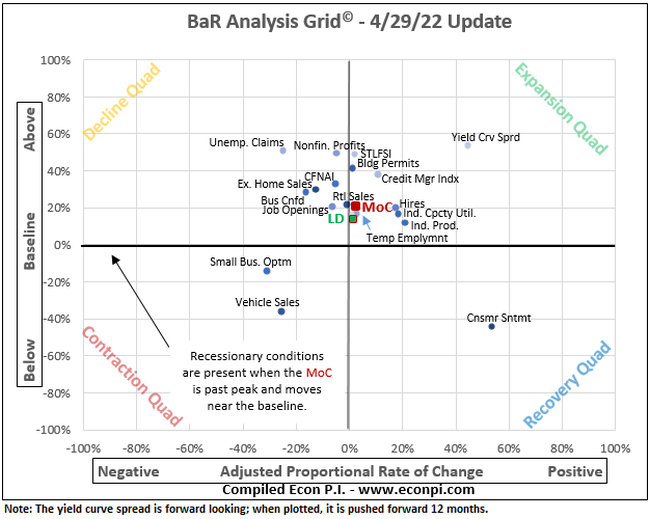
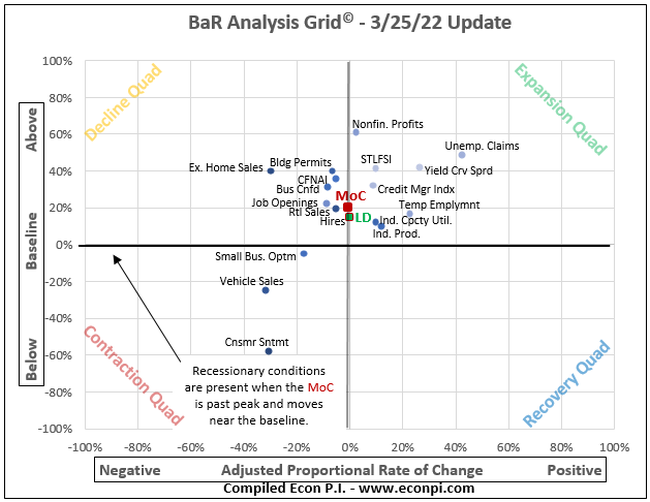
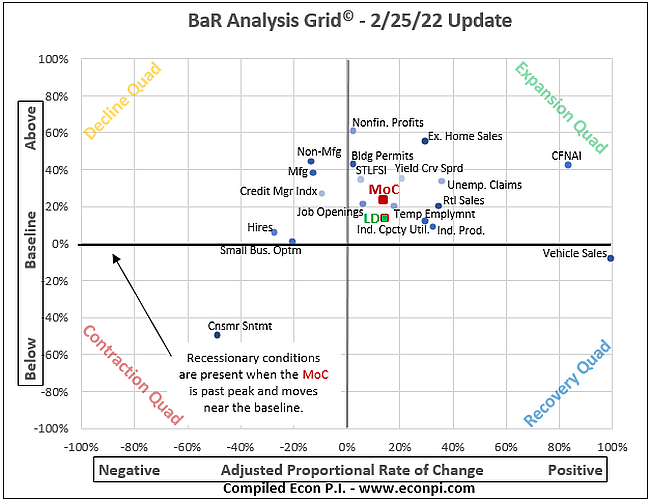
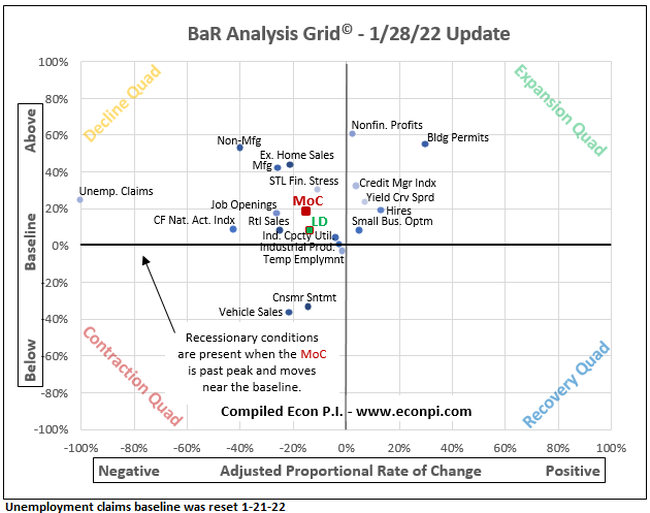
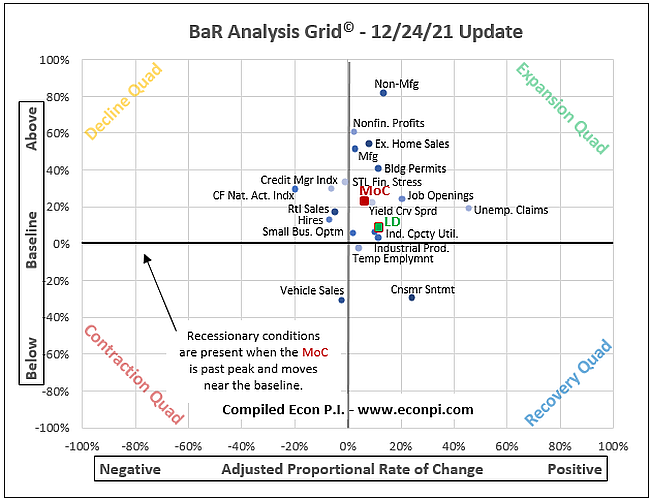
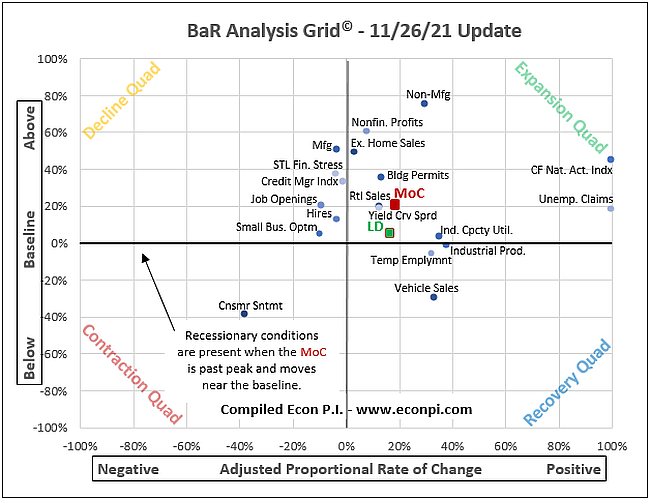
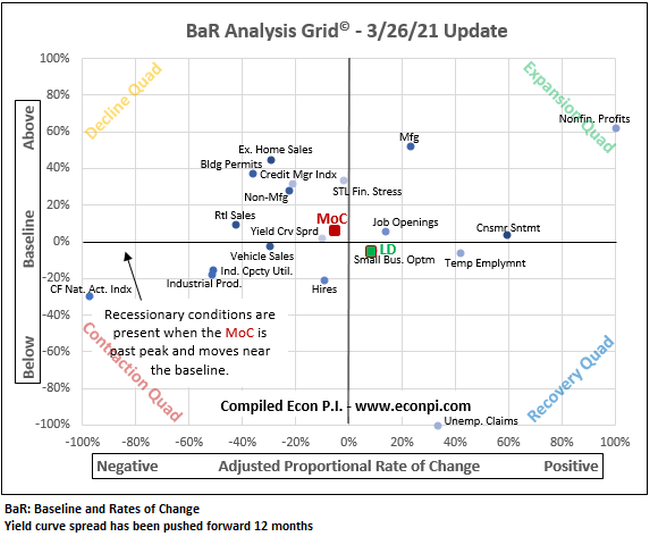
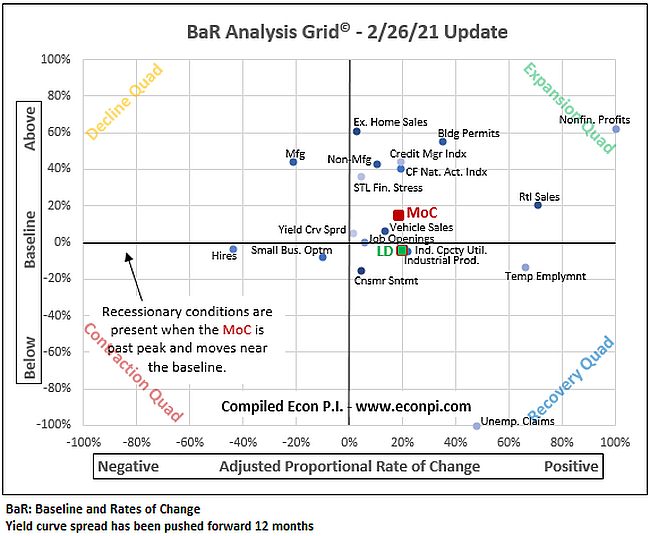
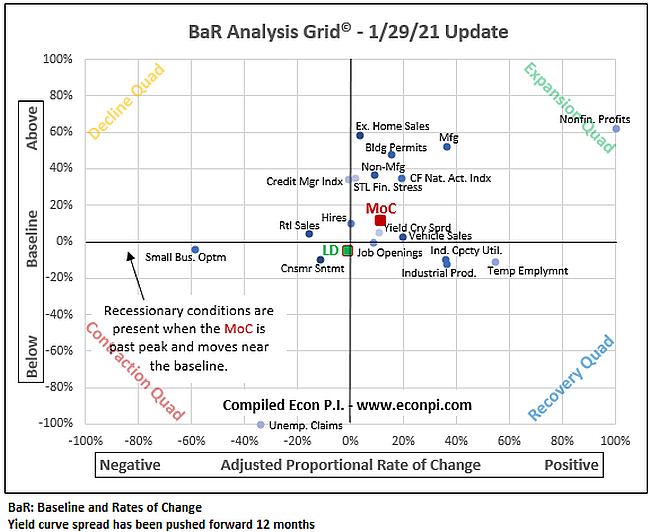
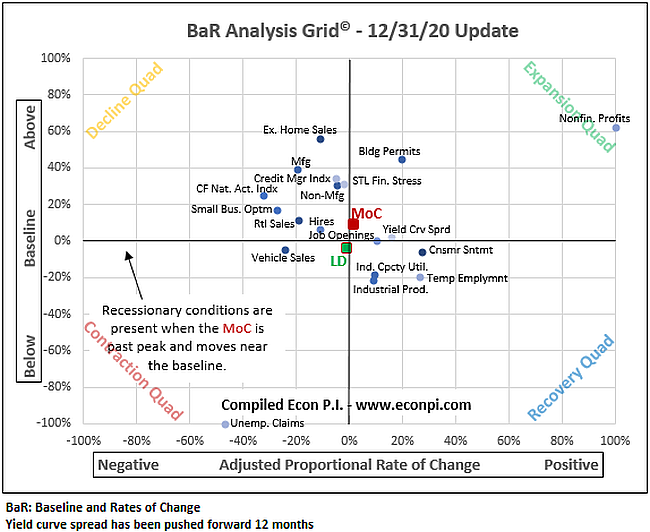
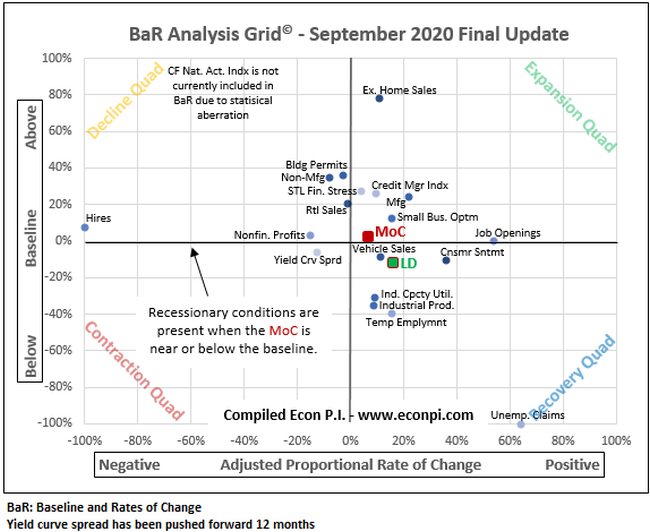
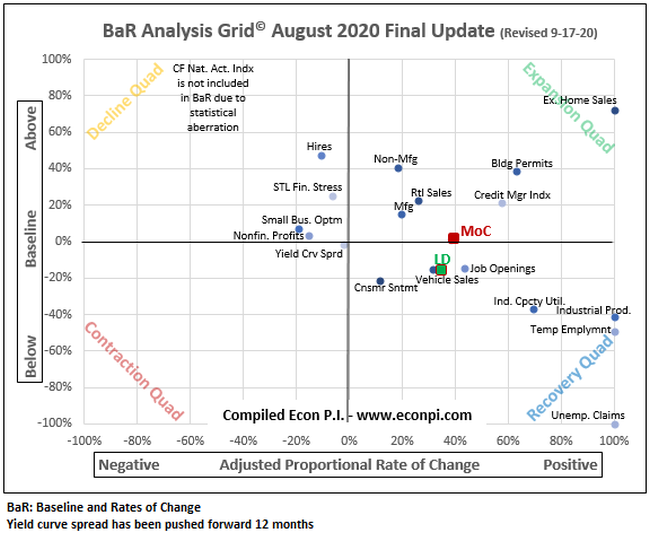
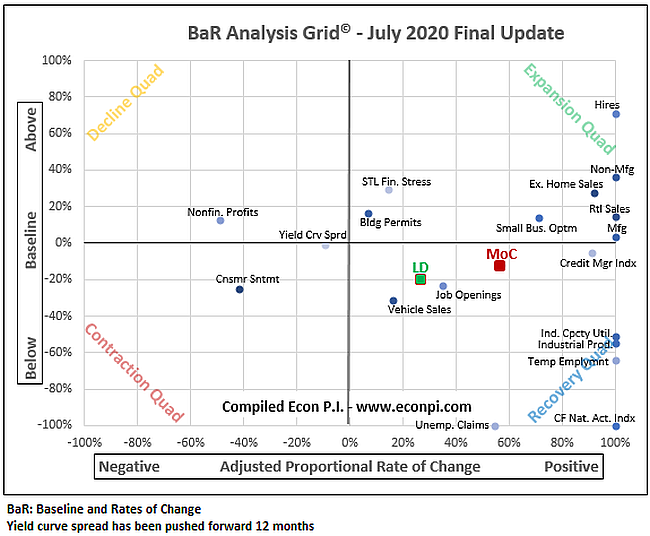
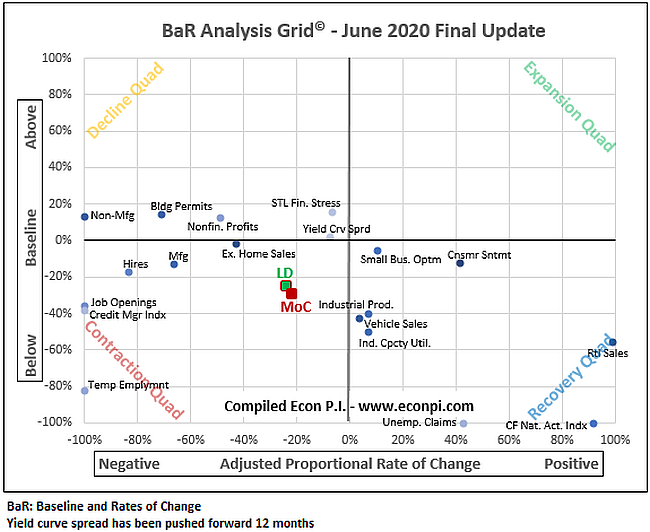
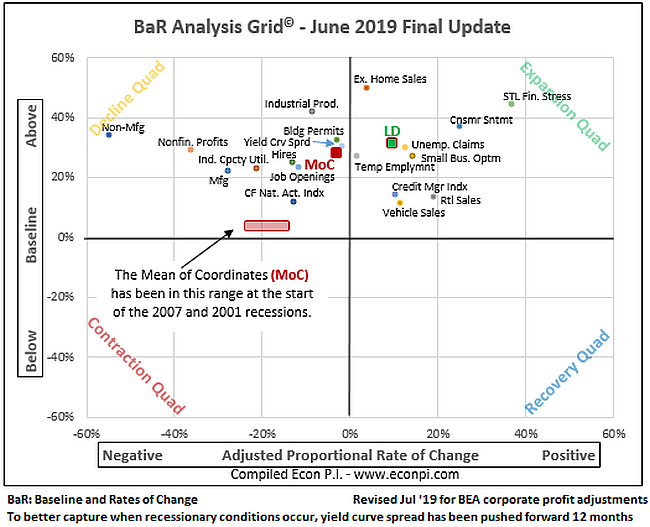
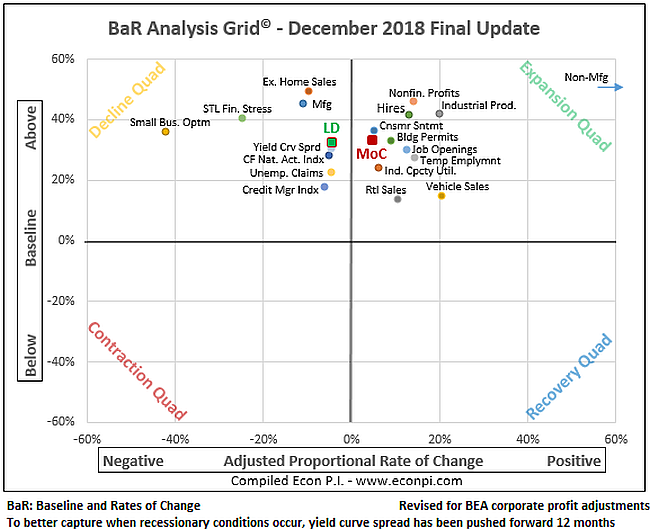
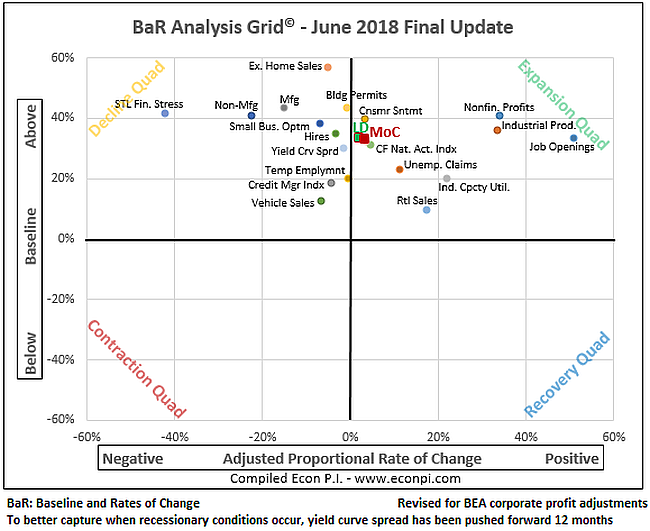
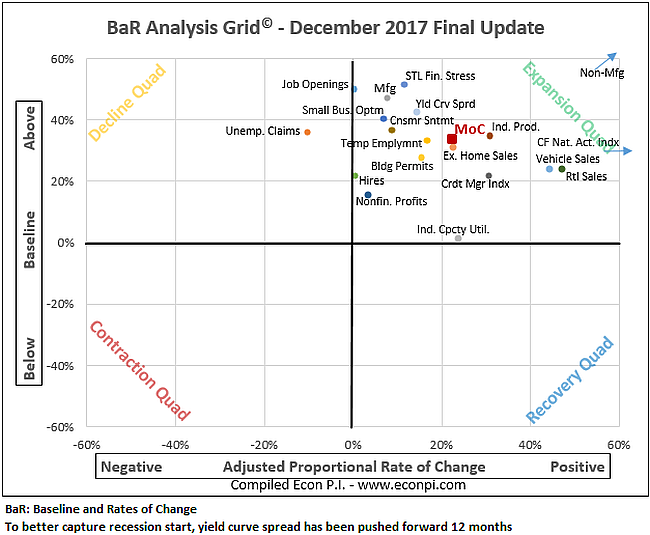
  • Calculates the mean of coordinates (MoC), the average of all plotted points, which shows the general state of the economy. The MoC is especially useful for determining when a recession is near and comparing grids from different periods of time.
  • Calculates a subset of nine leading indicators (LD) that gives an initial indication of changing economic trends. Five of the leading indicators are updated within the first week of a month, giving the earliest indications of emerging trends.
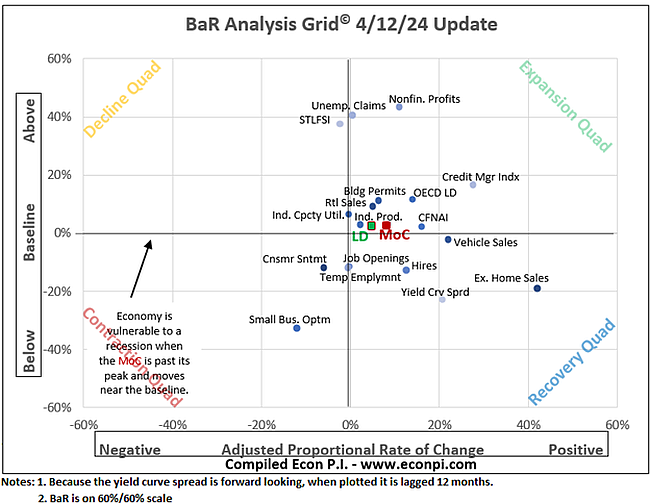
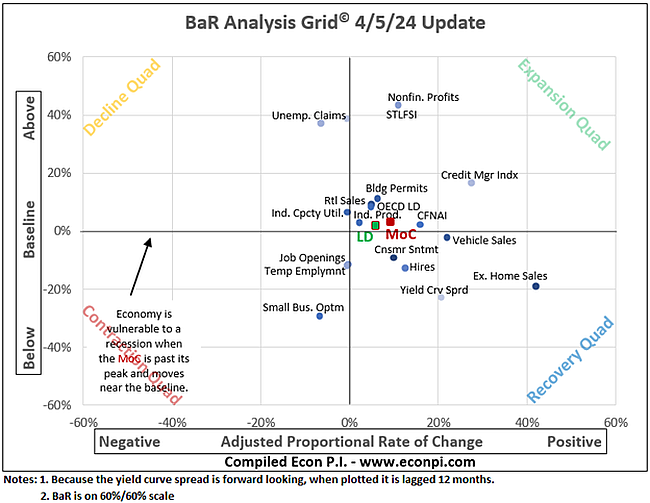
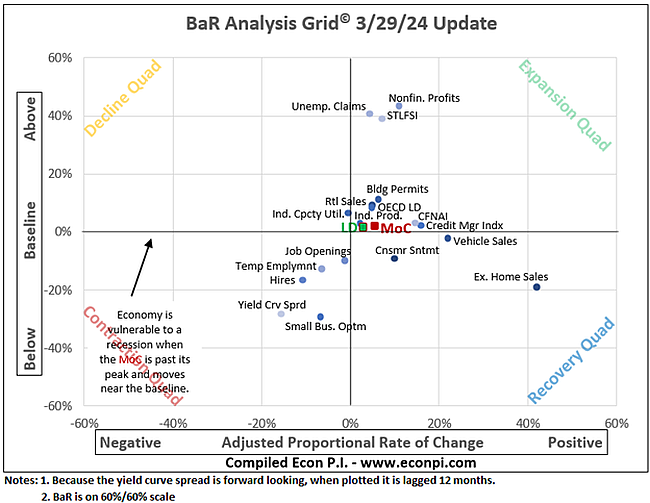
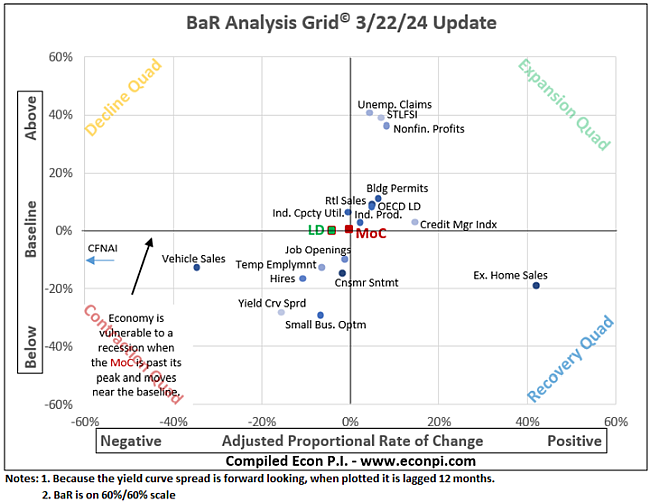
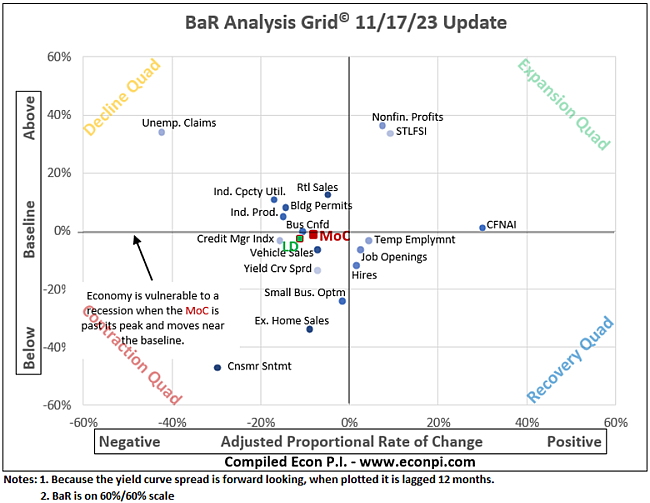
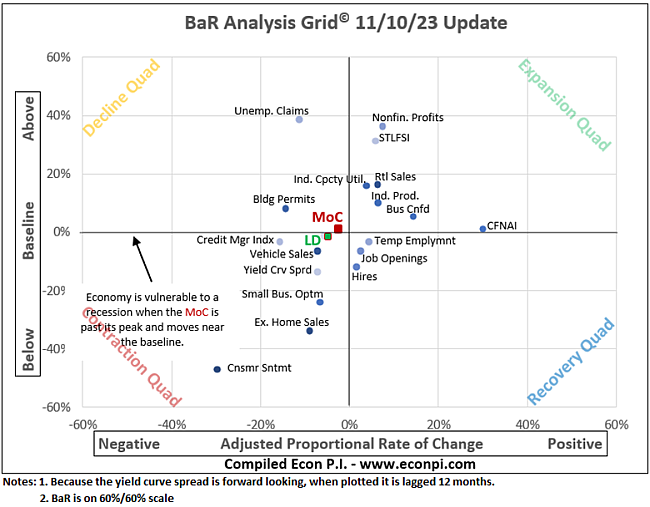
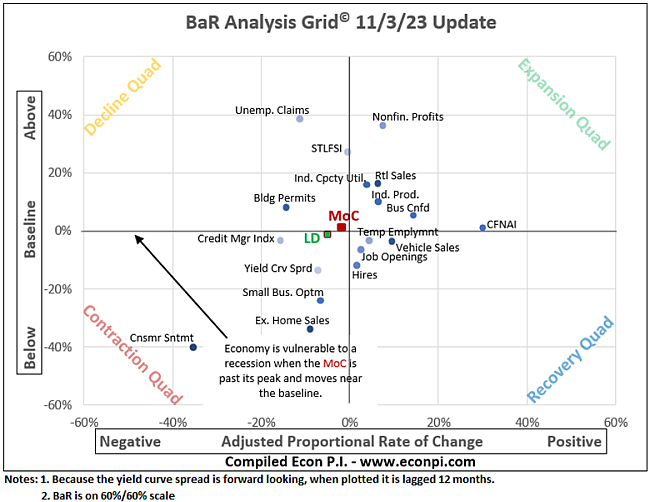
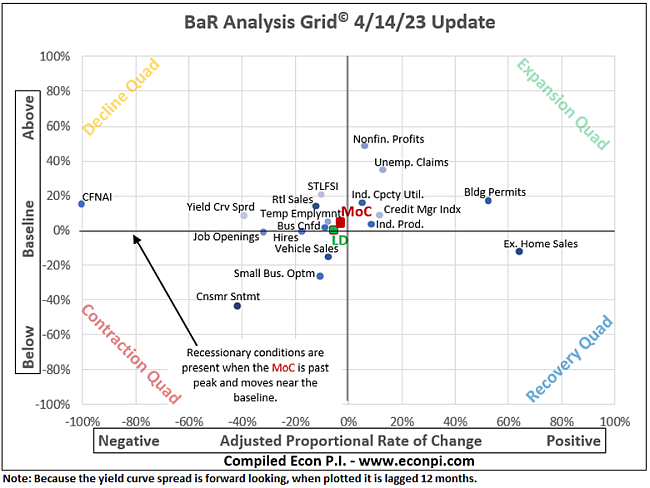
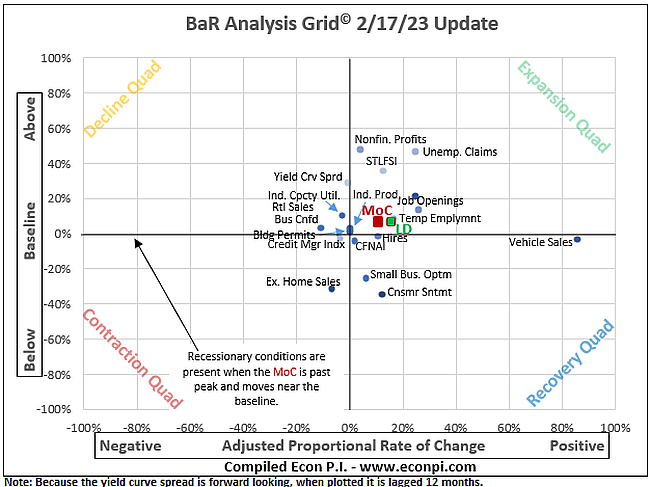
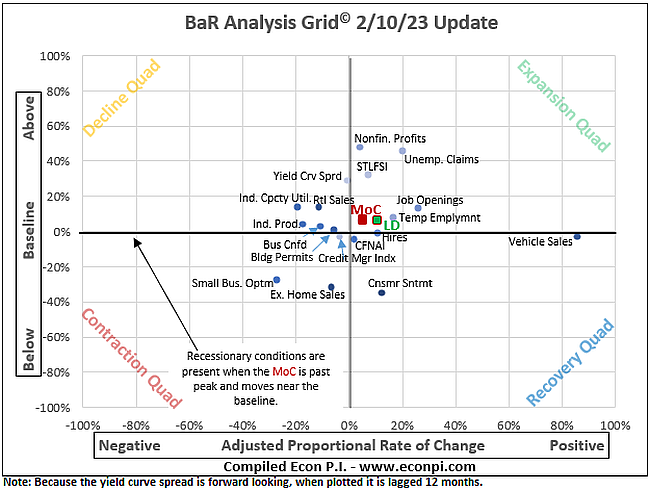
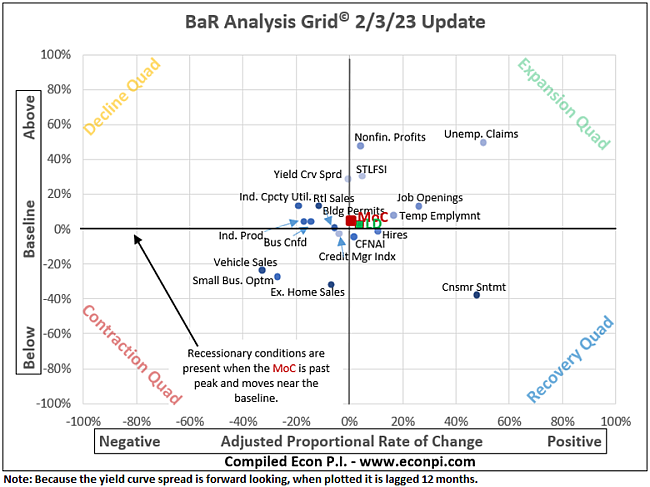
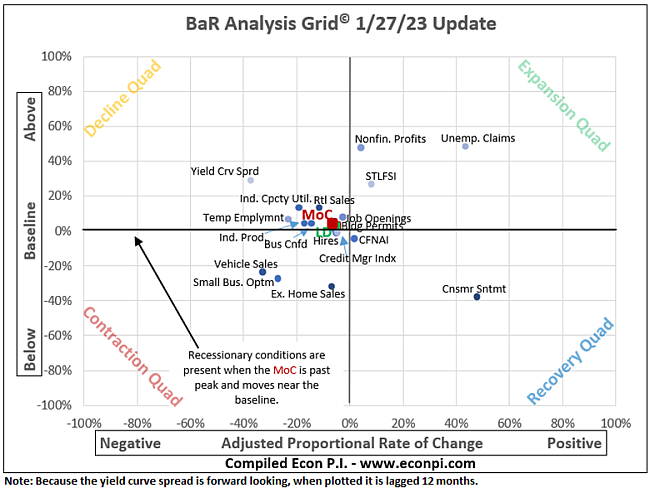
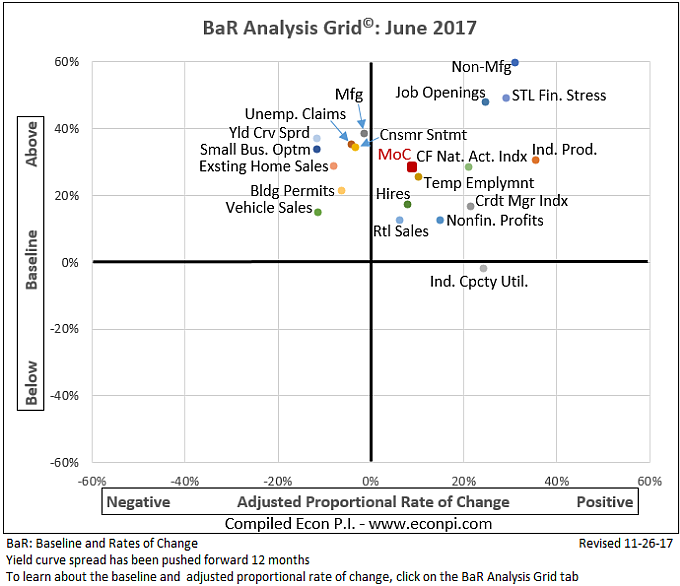
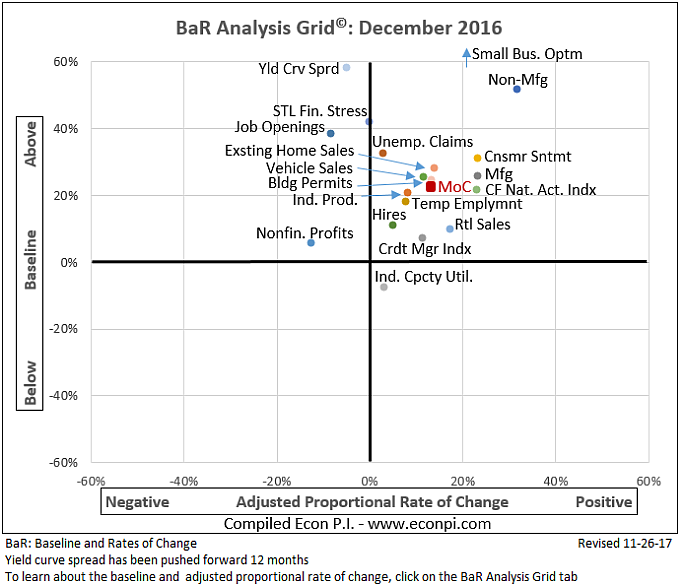
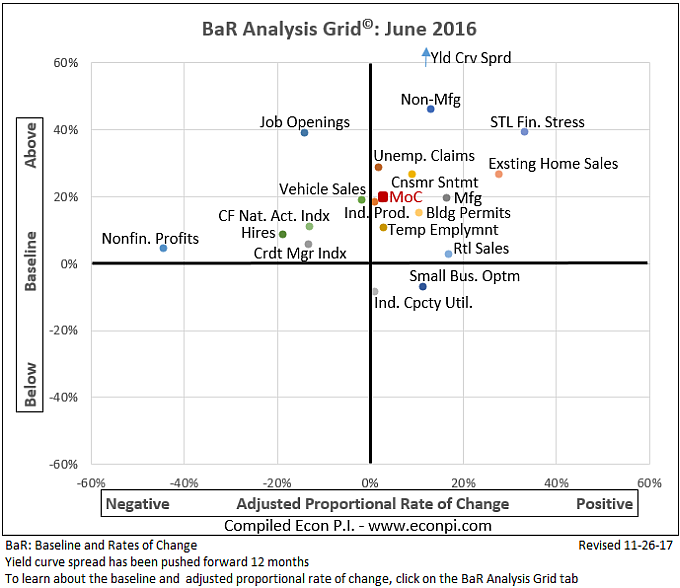
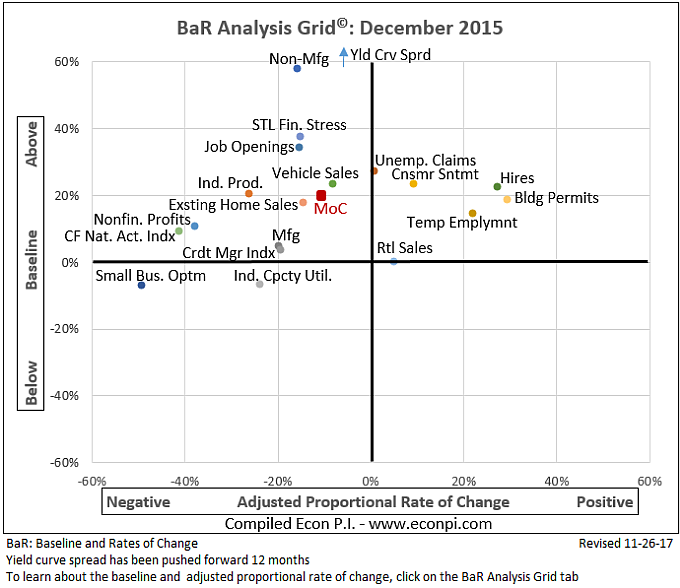
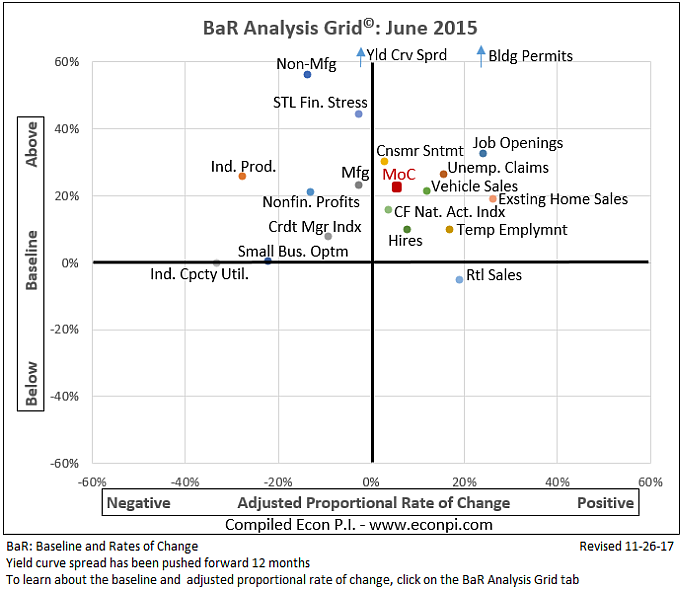
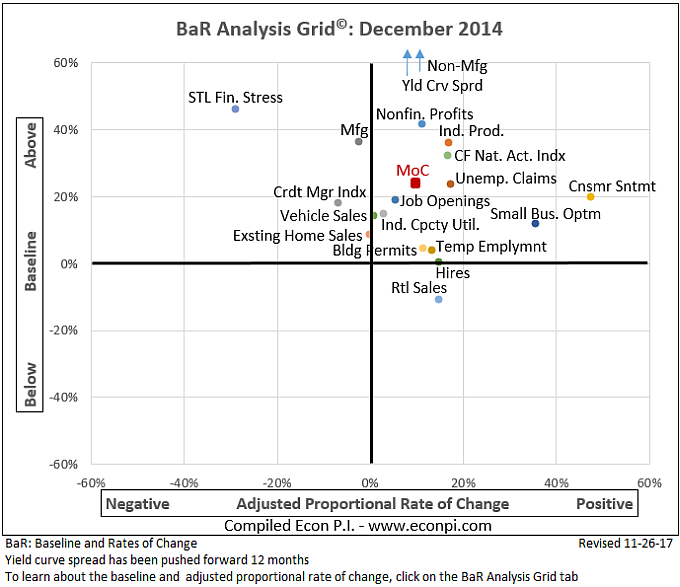
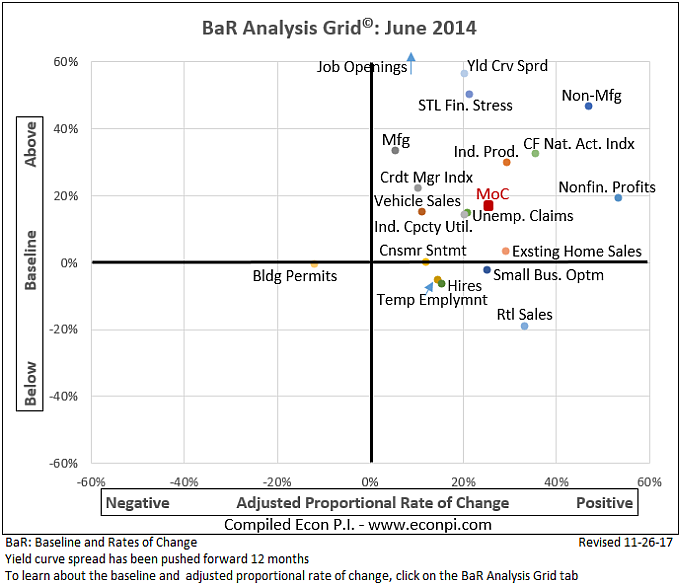
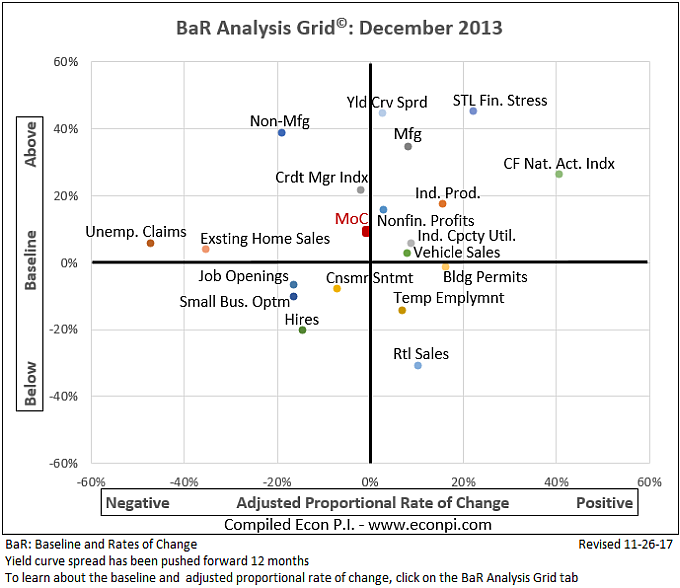
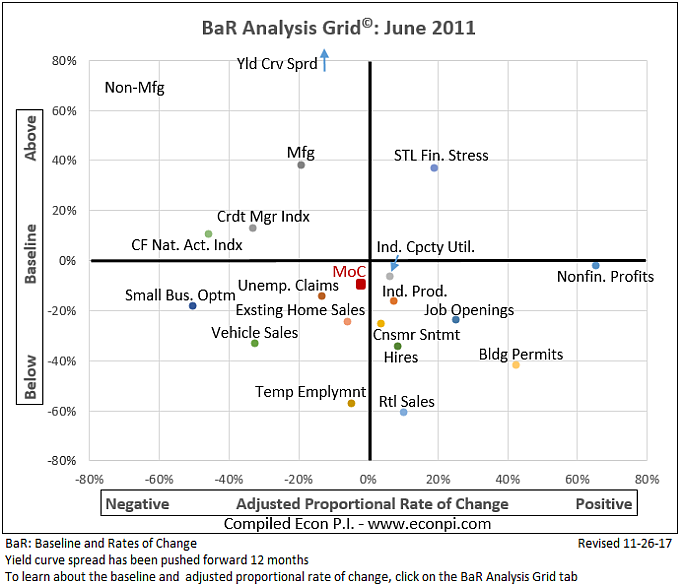
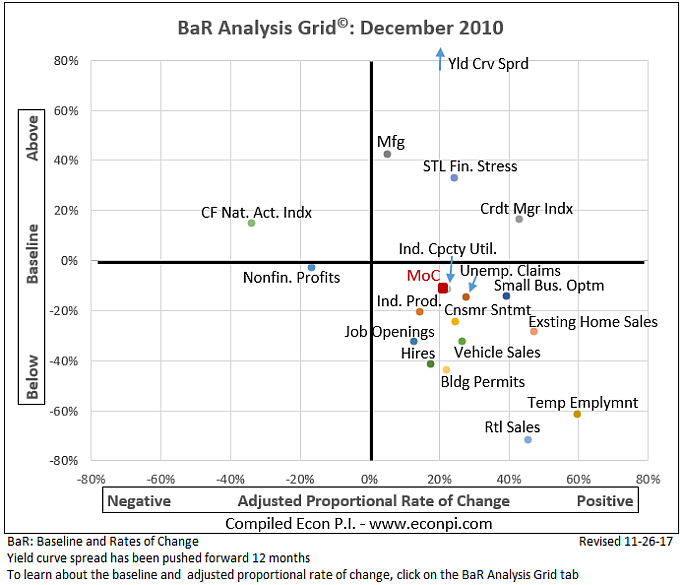
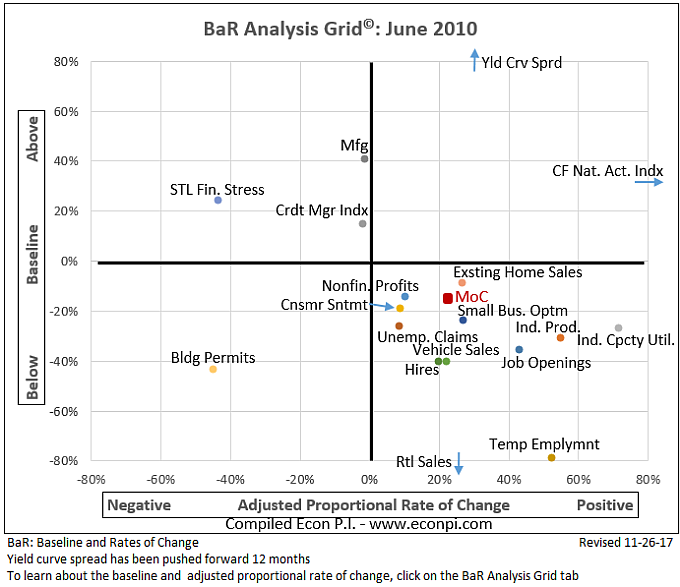
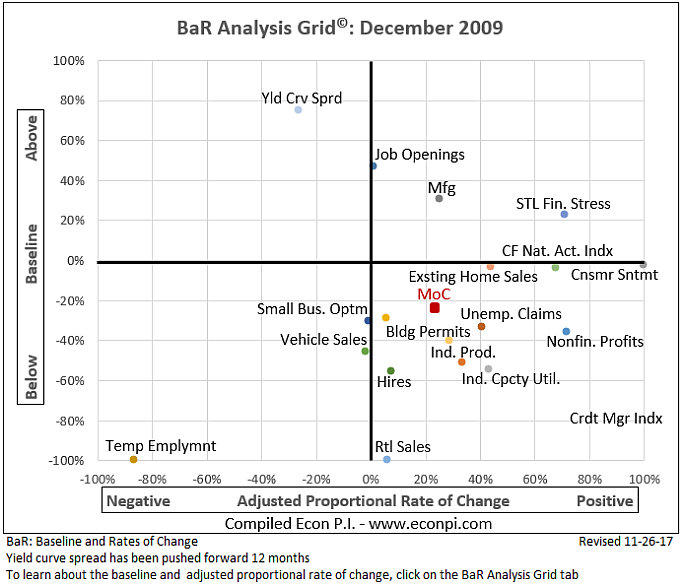
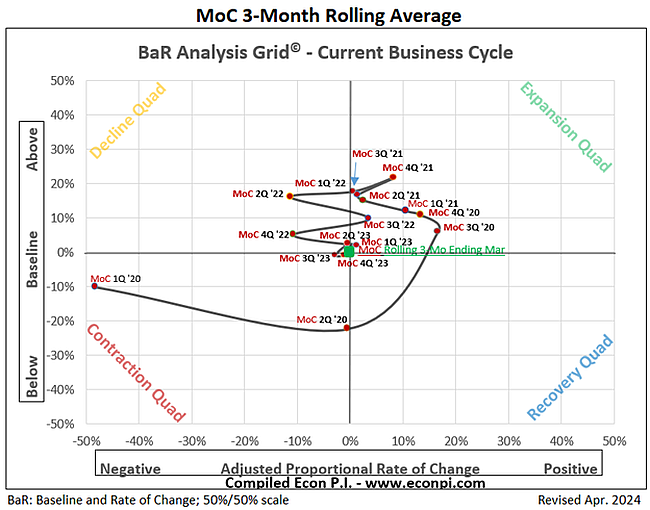
The economy is expanding when the MoC shifts to the right and moves upward. The economy is slowing when the MoC shifts to the left and moves downward. 
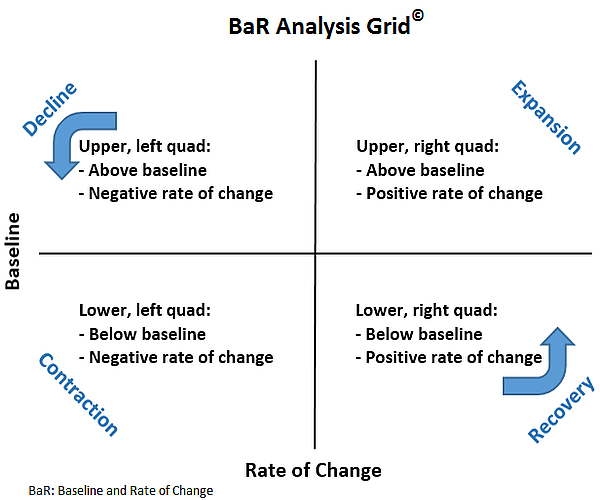
BaR Overview r3

How to Read the BaR

Positive economic growth

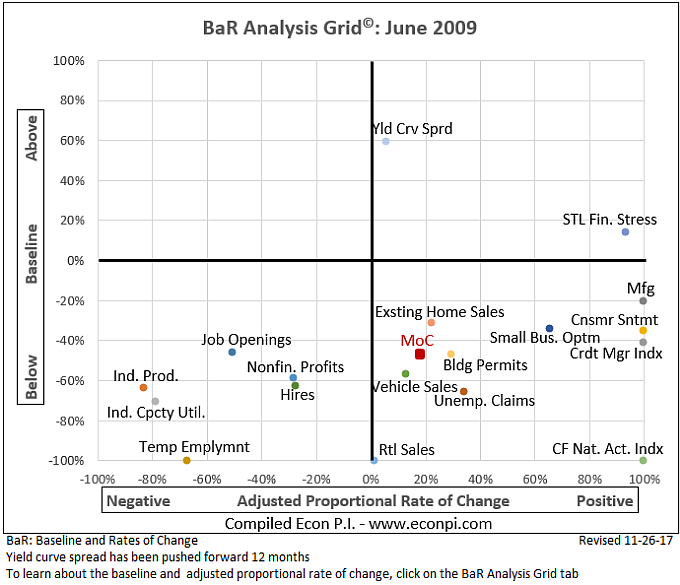
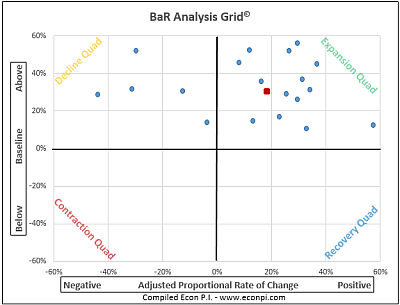
The BaR indicates expanding economic growth when the majority of the plotted economic indicators (blue points) and the MoC (mean of coordinates - red point) are in the expansion quadrant and well above the baseline.
Read Positive Growth

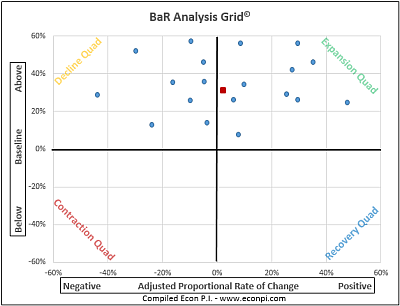
Positive, but slowing economic growth
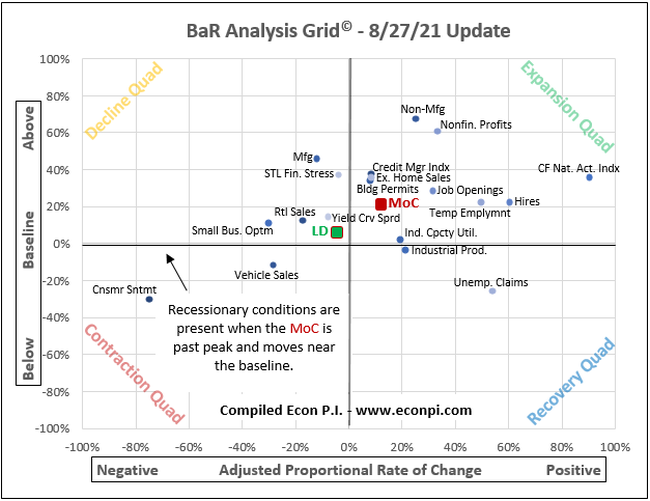
Economic growth is cyclical. During an expansion cycle, indicators hits new highs, then stall or decline slightly, then move upward again. This can result in a number of economic indicators moving into the decline quadrant and the MoC shifting leftward. With such a movement, as long as the MoC and the economic indicators remain above the baseline, the economy is still growing, but at a decreasing rate of growth. 
Read Positive Slowing Growth
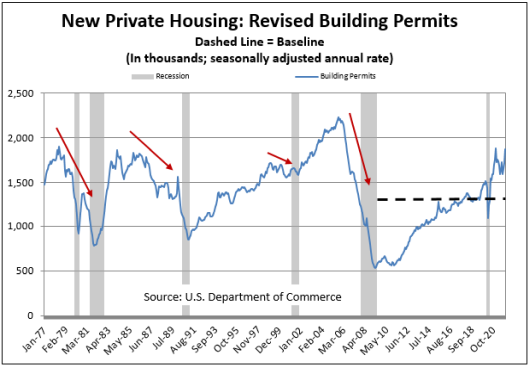
For example, a drop in building permits from 1.36 million to 1.30 million would be a decrease in the rate of change. Although growth is still positive (1.30  million permits were issued), the rate of change is negative. The indicator would be plotted in the decline quadrant. All indicators periodically move into the decline quadrant, even as the economy is expanding. A red flag is raised when an increasing number of indicators stay predominately in the decline quadrant and move closer to the baseline. 

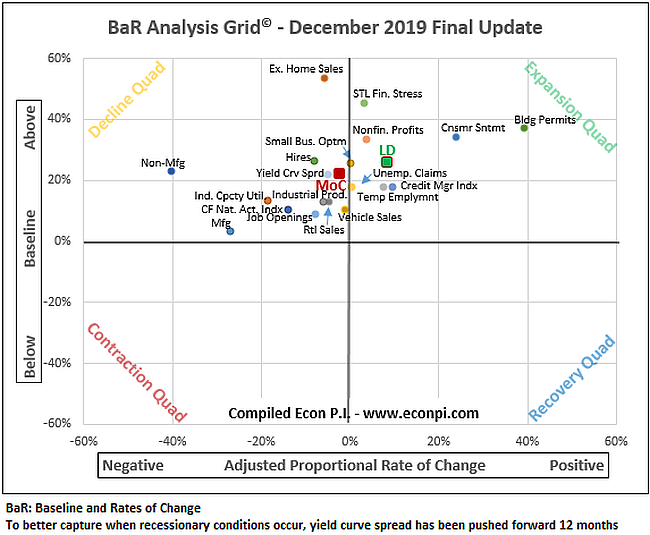
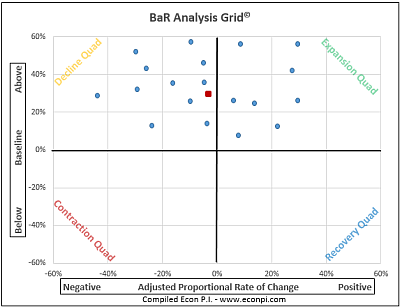
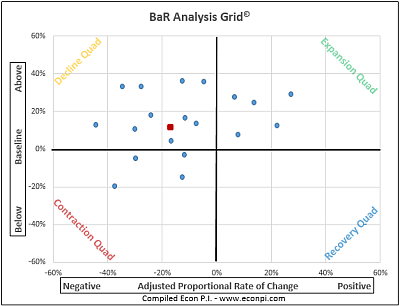
Slowing economic growth, pre-peak or post-peak
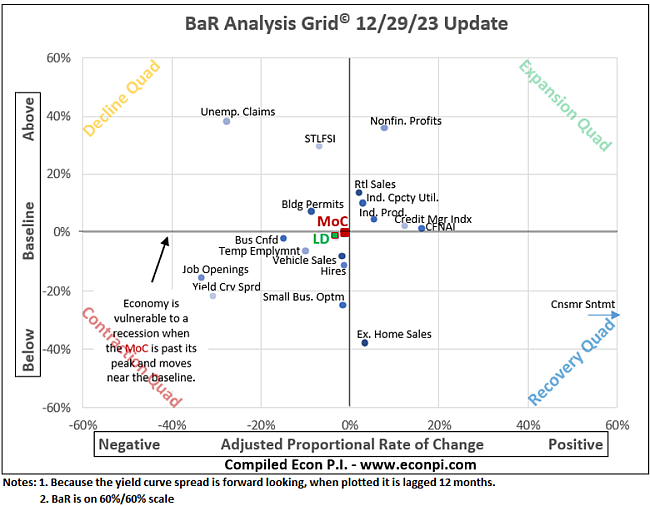
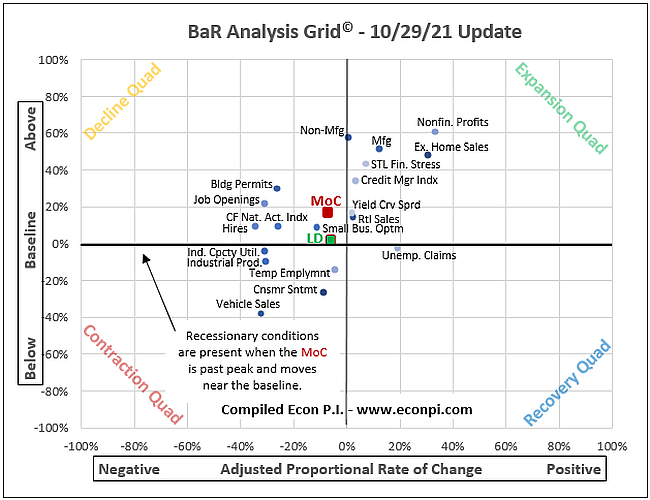
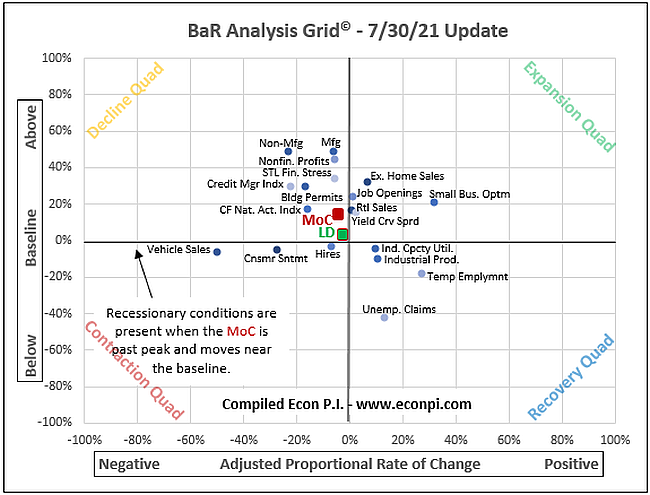
Even when the economy is growing, due to the cyclical nature of the economy, the MoC and a majority, or near majority, of economic indicators may occasionally move into the decline quadrant. During periods of economic growth, this will be temporary. The MoC and most indicators will move back into the expansion quadrant. However, if the economy has peaked, a grid like the one shown below is a pre-recessionary pattern. As the economy slows, the MoC will mostly stay in the decline quadrant and gradually move towards the baseline.
Read Slowing Growth

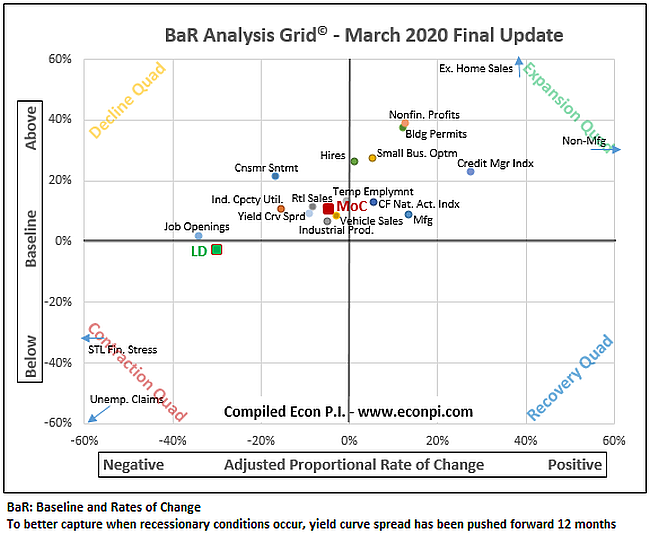
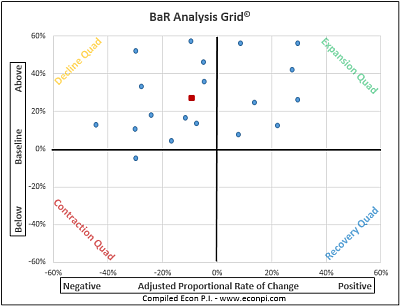
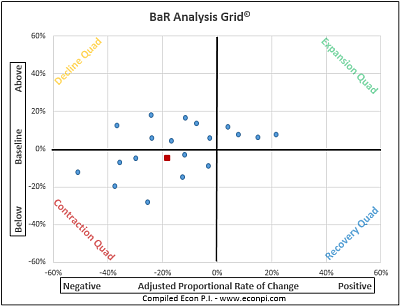
Stalling economic growth
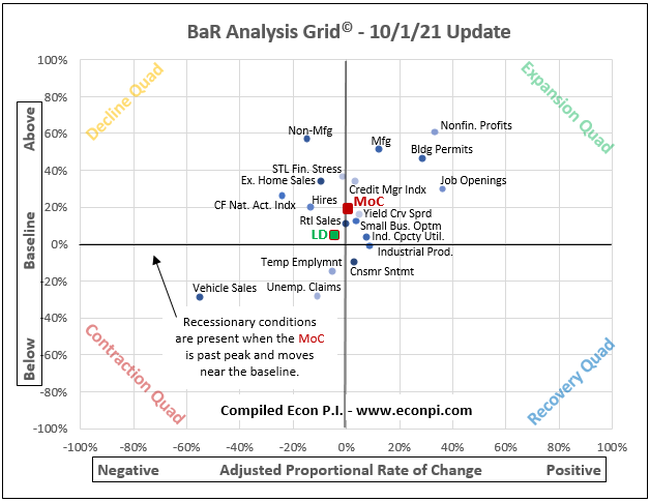
When the MoC mostly stays in the decline quadrant and several economic indicators are nearing or have gone below the baseline, this indicates that the economy is stalling. Although the economy can recover briefly, and the MoC may shift to the expansion quadrant, this will be temporary. The economy is still growing, but at a declining rate. 
Read Stalling Growth

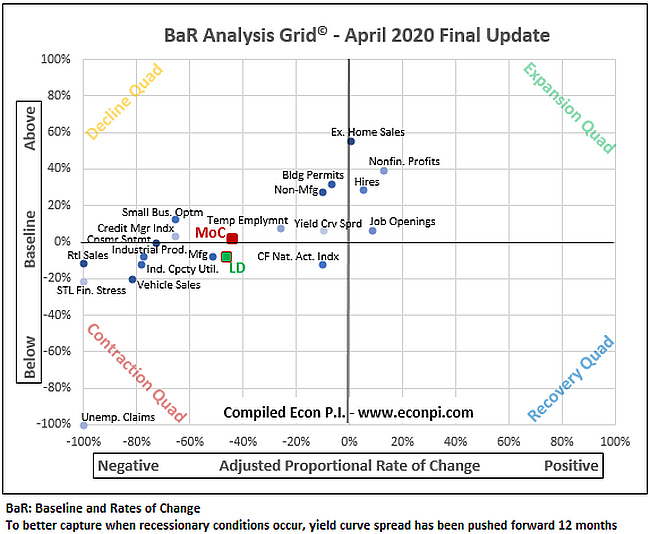
Nearing economic recession
After the economy has peaked and the MoC has mostly remained in the decline quadrant, as more and more economic indicators near or go below the baseline, this indicates that recessionary conditions are building. Here too, the economy is growing, but it has slowed significantly. 
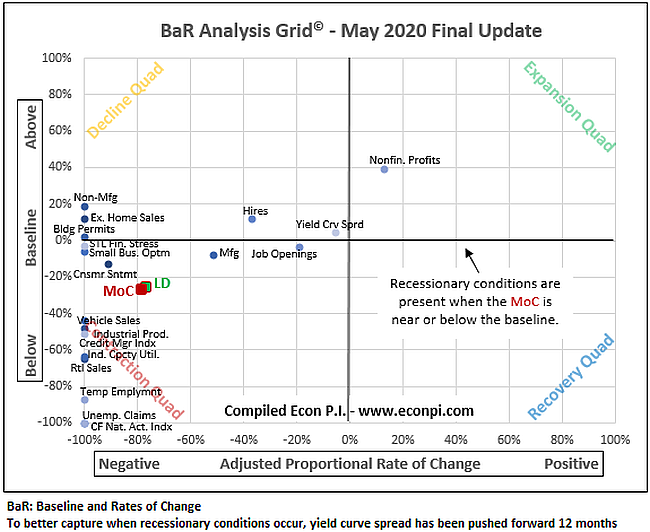
Read Nearing Recession

Economic recession
When the MoC nears or goes below the baseline, this generally indicates that the economy has begun a recession. If a recession has not begun, the economy is highly vulnerable to one. 
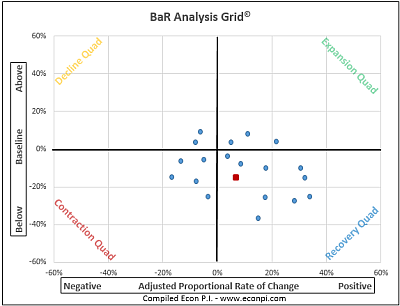
Read Recession

Economic recovery
When a recession ends, the MoC and most indicators will move into the recovery quadrant. However, again due to the cyclical nature of the economy, during recovery the MoC can shift into the contraction quadrant occasionally. This is usually temporary, but it does indicate there is some economic vulnerability during a recovery. 
Read Recovery


Rate of Change

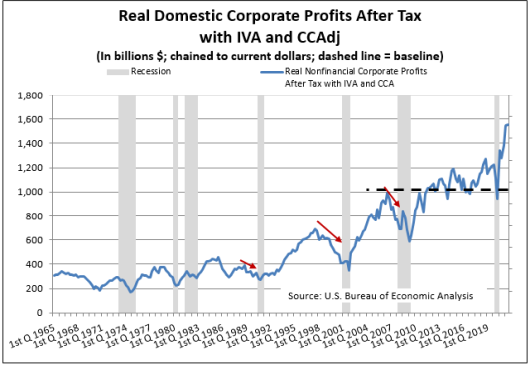
The data for most economic indicators are updated monthly. Two leading indicators are updated weekly and compared to the ending data of the previous month. Corporate profits are reported and updated quarterly. 

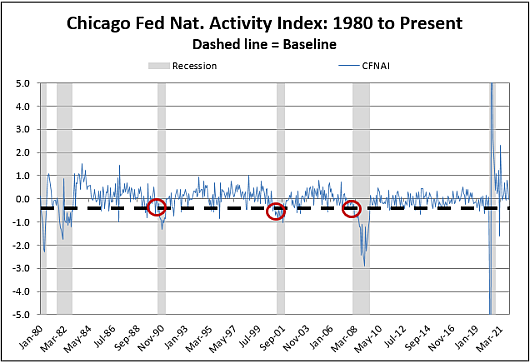
The rate of change is adjusted by the "range of change" when indicators are plotted on the BaR Analysis Grid©. For example, the largest monthly range of change for private building permits since 1977 was 30% (this excludes months with extreme variations). For a month with a rate of change of 10%, the rate of change plotted on the BaR for building permits would be 33% (10% divided by 30%). This method gives all plotted indicators a base of 100 (33% = 33 / 100 = proportion / base]). For an indicator with a range of change of 15% that had a monthy rate of change of 5%, it too would be plotted with a 33% change (5% divided by 15%; resulting in a base of 100). With this methodology, each indicator, except one, has an equal influence on the MoC (read more in the FAQs). The exception is the Chicago Fed National Activity Index. Since the pandemic economic shutdown, the CFNAI often has large data swings from month to month. For this reason, its influence on the MoC has been decreased.

Baselines

Baselines are intended to show where an indicator is likely to be when a recession begins. Each indicator's baseline is determined by its unique characteristics and historical trends prior to recessions. Like the rate of change, the baseline percentages are also proportionally adjusted when plotted, based on each indicators unique range of high and low values during a business cycle. Charts of the economic indicators and their baselines can be seen here.

Grid Abbreviations June 2020
 

Contact                    About                    Terms of Use                    Privacy Policy           

Copyright © 2015 - 2022 All Rights Reserved

Information provided on econpi.com is for informational purposes only. By using this site you agree that no advisory, fiduciary, or professional services relationship is created between you and econpi.com. No information provided on this site shall be construed as legal, accounting, investment, financial, tax, or other professional advice on any matter.