| Q: What are the benefits of the BaR Analysis Grid©? |
A: The BaR provides unprecedented insights into how the business cycle unfolds and signals how near the economy is to a recession. The BaR not only plots key economic data, but also the sentiment of economic stakeholders: consumers, small businesses, credit managers, and purchasers. With this combination of crucial data and sentiment, the BaR clarifies current economic conditions and indicates likely near-term trends.
The BaR shows that the business cycle is composed of multiple mini-cycles. Too often, economic "experts" give dire warnings that the downside of each mini-cycle signals a pending recession. In reality, these are the normal ups and downs of a business cycle. The BaR distinguishes between expected, regular mini-cycles and the last fatal cycle that occurs before a recession.
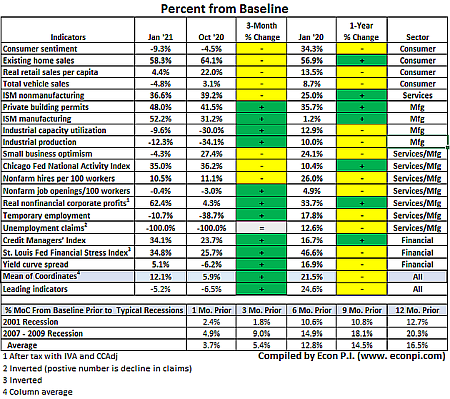
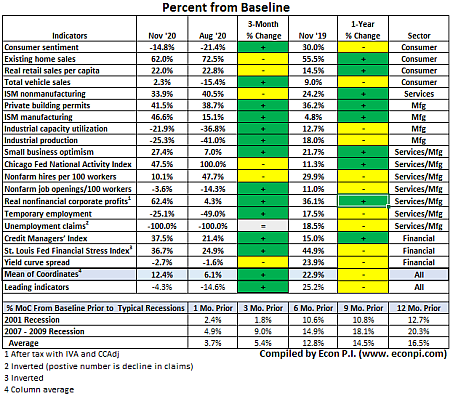
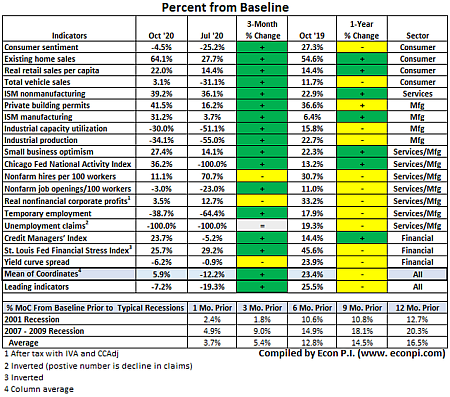
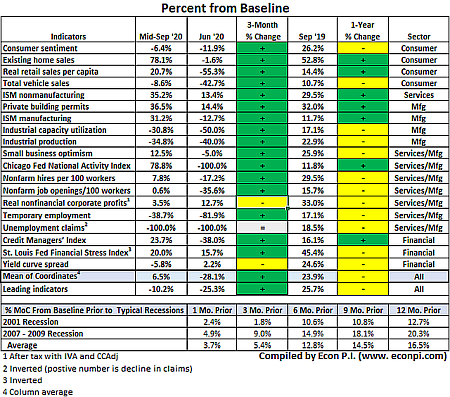
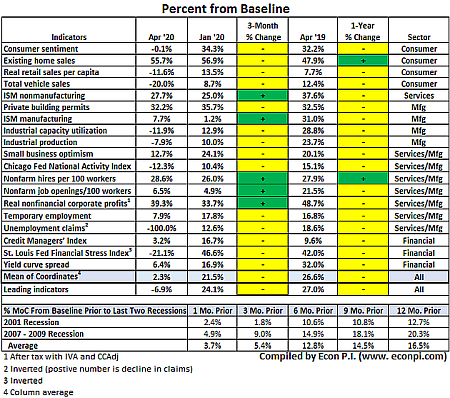
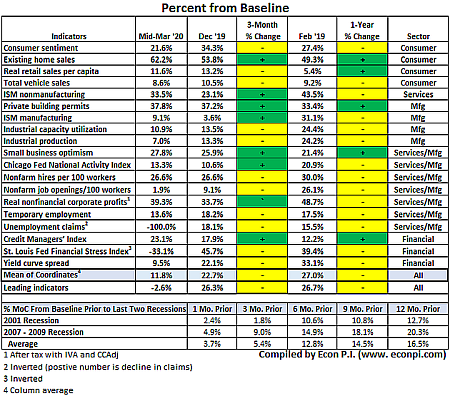
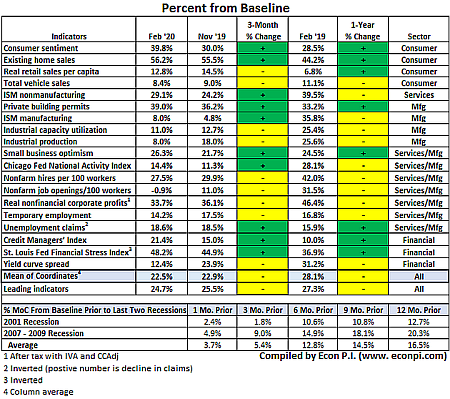
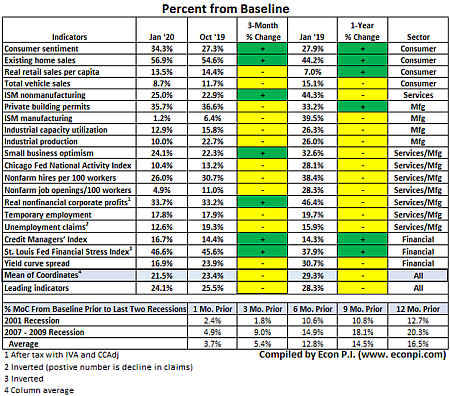
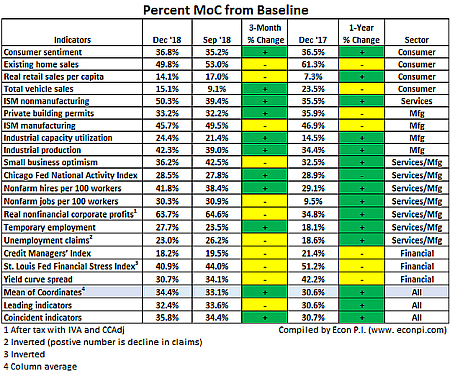
Due to their simple formats, a quick glance of the BaR grid and Percent MoC from Baseline table on the homepage tell you more about economic conditions than hours of reading narrowly-focused, often contradictory, articles and analysis.
Another important benefit of the BaR is that during the first week of the month five of nine leading indicators are updated. This is the first published data on the Internet that shows emerging trends.
Lastly, by mid-month, 15 of 18 indicators have been updated. This too provides an update that is as "real time" as is possible with economic data. Experience shows that the MoC (mean of coordinates) generally shows modest change from the mid-month update until the end-of-month update, by which time all 18 indicators have been updated.
|
| Q: Does the BaR predict when a recession will start? |
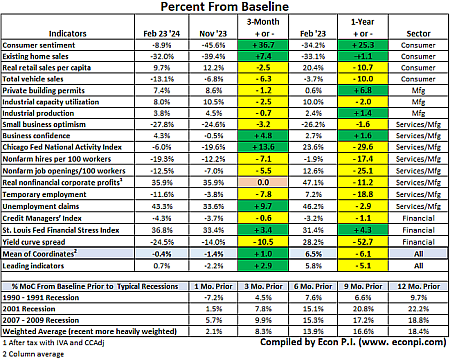
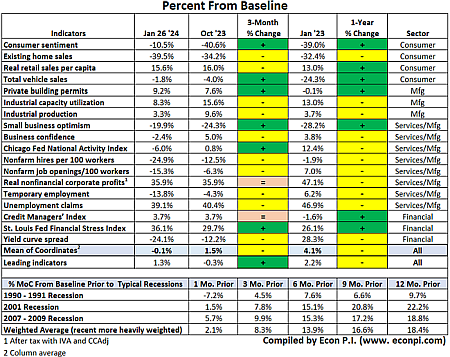
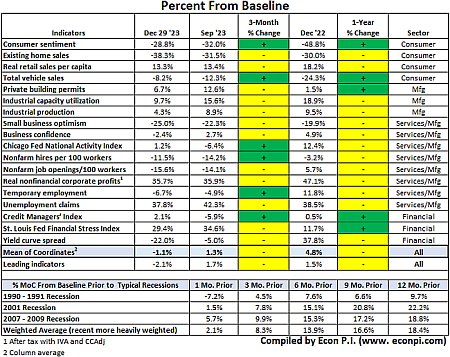
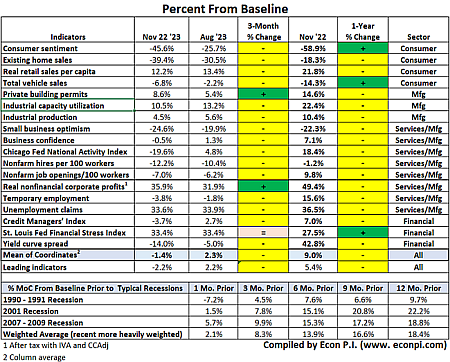
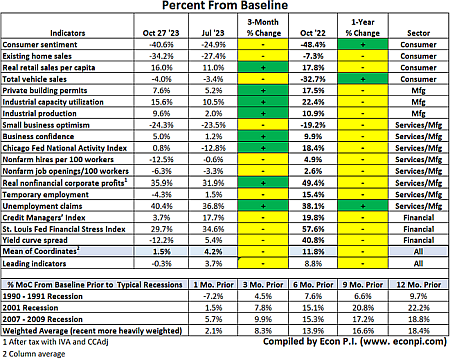
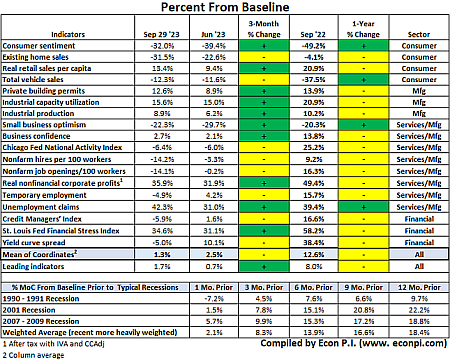
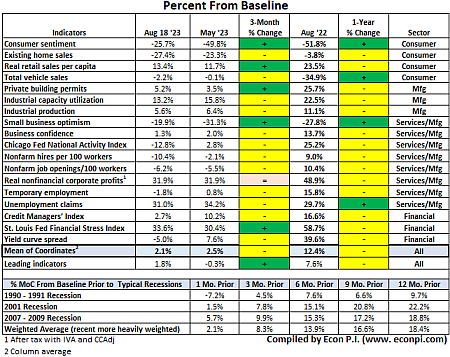
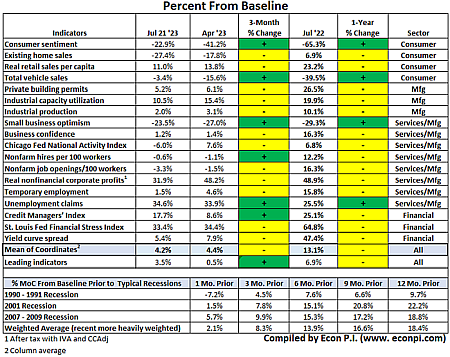
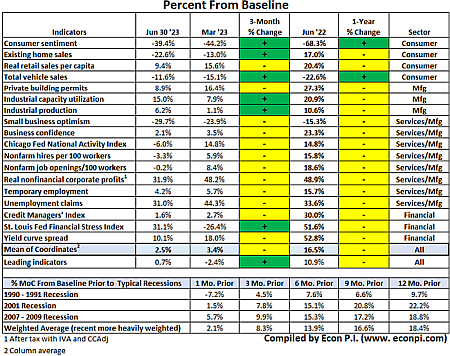
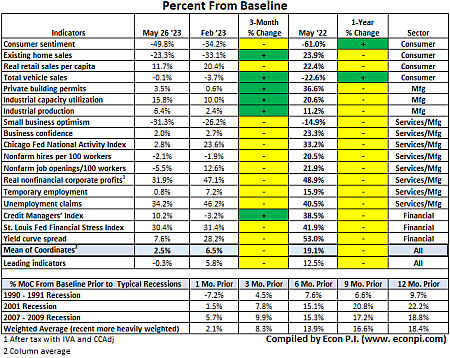
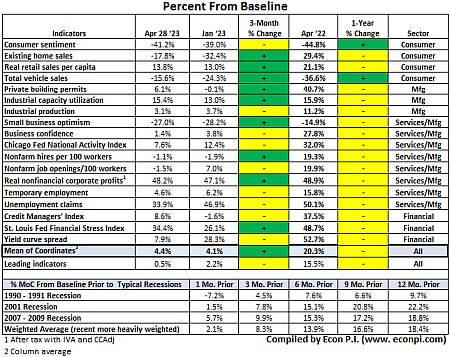
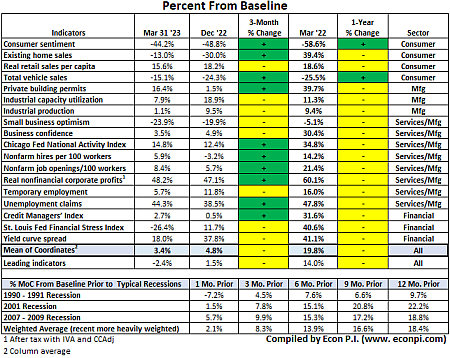
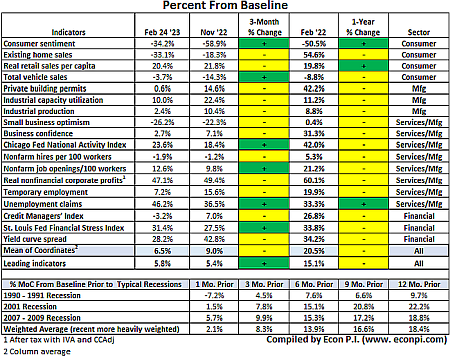
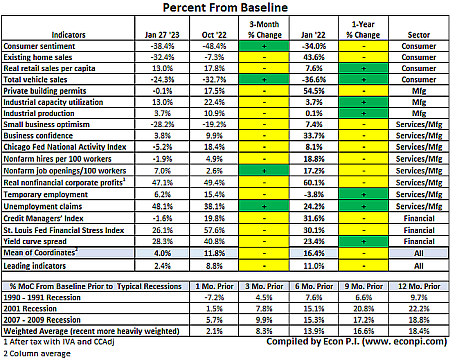
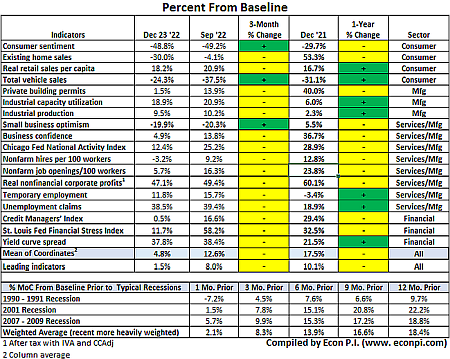
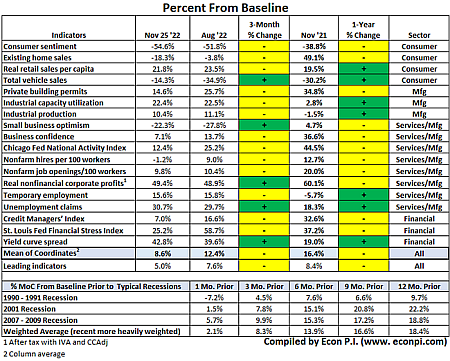
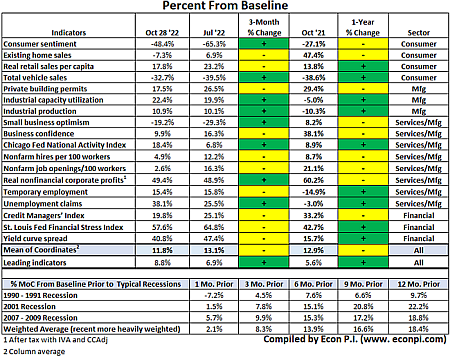
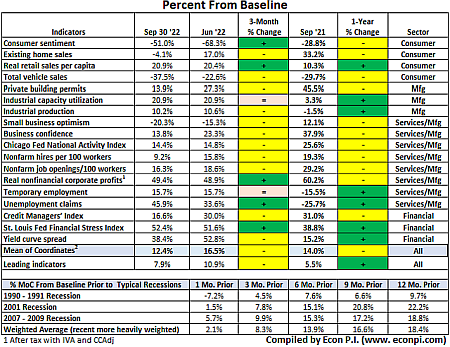
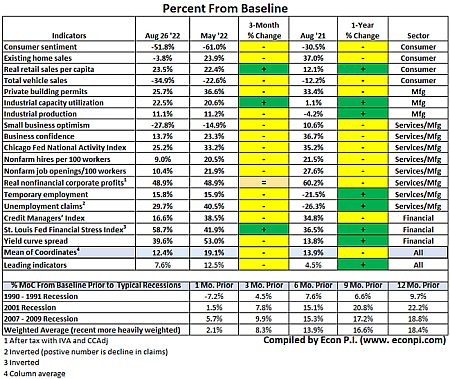
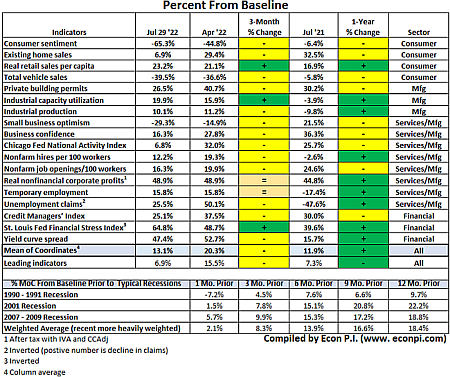
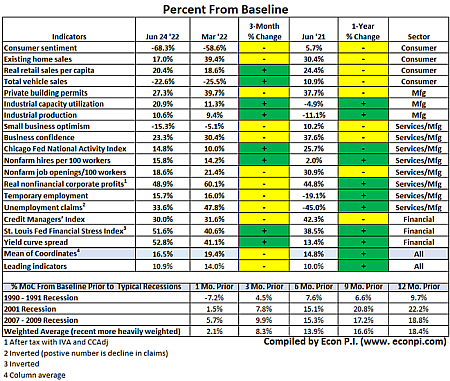
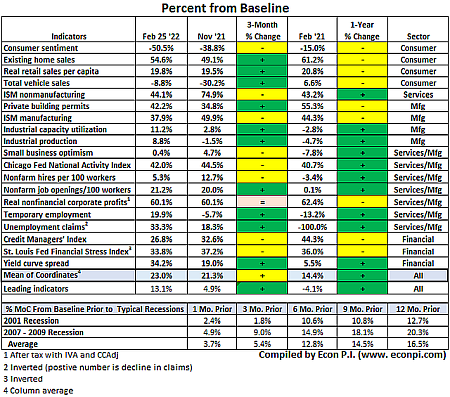
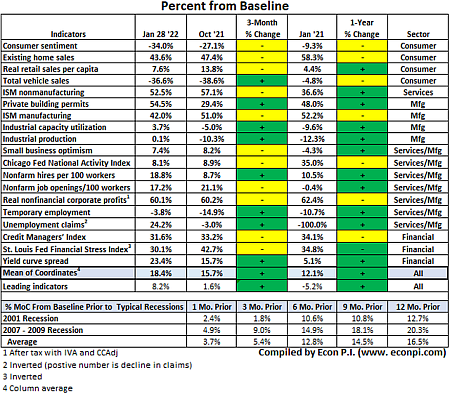
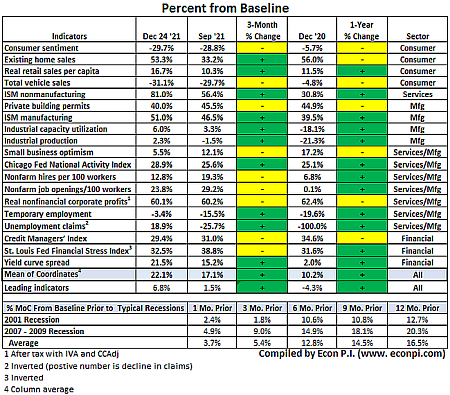
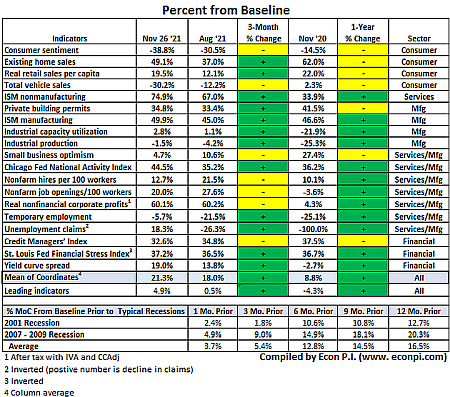
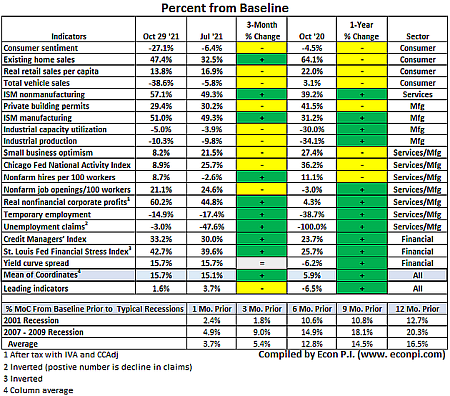
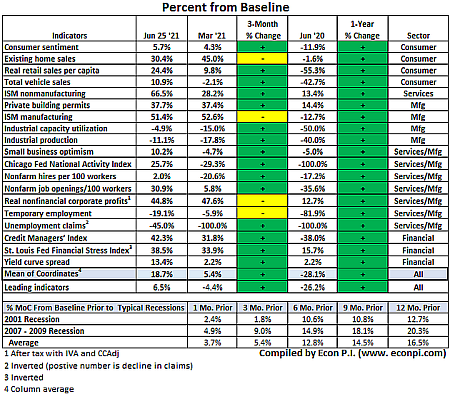
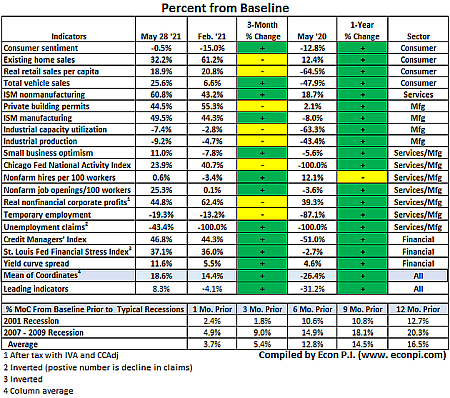
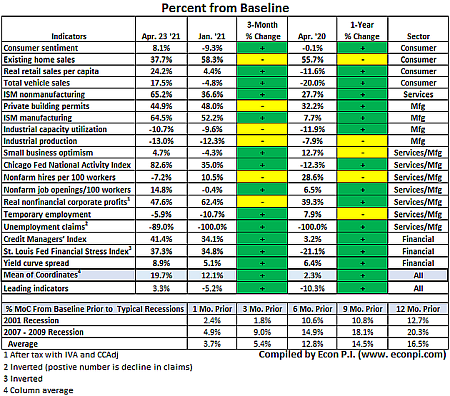
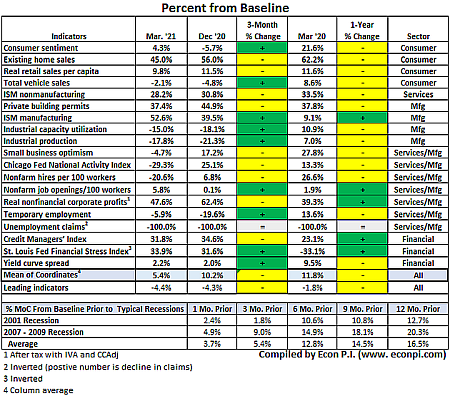
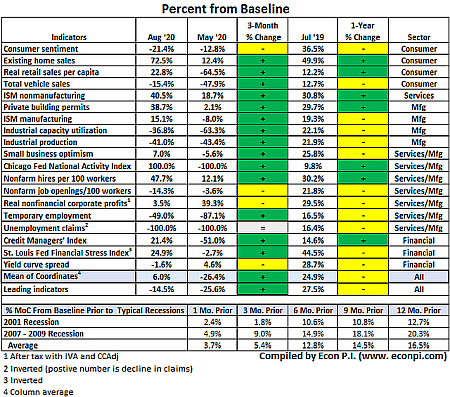
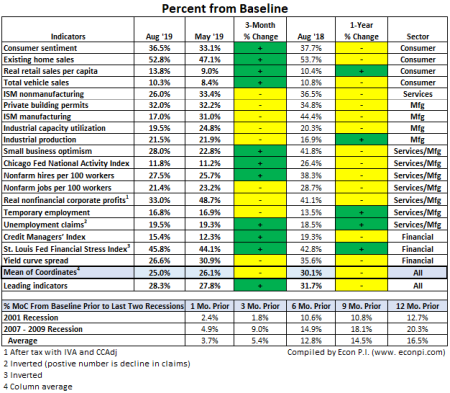
A: The MoC shows the progression of a business cycle. After it peaks, the MoC tends to move leftward and downward towards the baseline. Using a weighted average that weights recent recessions more heavily, and excluding the 2020 economic shutdown, the MoC was 8.3% above the baseline 3 months prior to the recession starts, and 2.1% above the baseline 1 month prior to the recession starts.
|
| Q: How do I read the BaR? |
A: Click on the BaR Analysis Grid tab and scroll down to the How to Read the BaR section. Once understood, the BaR is easy to follow and understand.
|
| Q: What is an economics P.I.? |
A: Econ P.I. is the name of this website. The name is intended to convey that facts are presented here, not opinion. The founder of Econ P.I. does not claim to be an economics P.I., as some well-intended individuals have suggested. Econ P.I. refers only to this website, not to a person.
|
| Q: What is the mean of coordinates (MoC)? |
A: The most important point on the BaR is the MoC, the mean of coordinates, which is the average of all plotted points. It indicates the overall condition of the economy and the outlook of economic stakeholders. After a recession, the MoC will largely stay in the recovery quadrant. As the economy strengthens, the MoC will eventually reach the expansion quadrant and begin to move above the baseline, which is an approximate recession threshold. The economy is the strongest when the MoC moves upward and to the right.
However, it is not unusual for the MoC to move into the decline quadrant even when it has an overall positive trend. This may happen briefly when the economy is expanding but the rate of growth slows, which is not uncommon during a business cycle.
Importantly, when the MoC stays mostly in the decline quadrant and moves towards the baseline, this indicates the economy may be moving towards a recession.
|
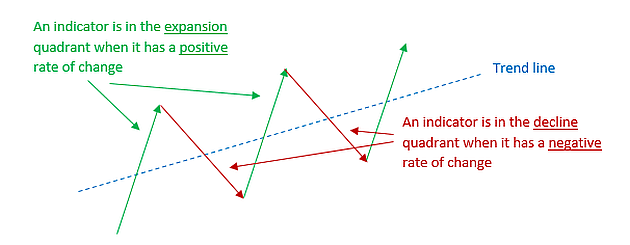
Q. Why do the indicators regularly swing between the expansion and decline quadrants?
|
| A. The graphic below illustrates how economic indicators with a positive trend line can swing between positive (green arrows) and negative (red arrows) rates of change. As all indicators have a tendency to hit new highs, and then stall or decrease slightly, indicators on a positive trend will predominately stay in the expansion quadrant, but will periodically move into the decline quadrant. |
 |
| Q: The yield curve spread as plotted on the BaR seems different than what is reported by the Treasury. Why? |
| A: The 10-year/2-year Treasuries term spread is pushed forward 12 months. Research by the St. Louis Fed shows that the term spread is forward-looking by approximately 12 months. By pushing the term spread forward when plotted ont the BaR, it is likely to be moving near the baseline when the economy slows significantly, or is headed for a recession. |
| Q: Shouldn’t the economic indicators used on the BaR be weighted? Aren’t some indicators more important than others? |
A: Each economic indicator used on the BaR has a “natural” weight in the real economy. For example, corporate profits are likely to have a significant influence upon other indicators. If a more influential indicator declines, its decline and its effect on other indicators will be captured on the BaR, mirroring what is happening in the economy.
In addition, analysis of historical BaR grids shows that the indicators that decline first prior to one recession may not do so before another recession. If heavily weighted indicators were slow to decline prior to a recession, this would defeat the purpose of the BaR. However, due to the large swings in the Chicago Fed National Activity Index (CFNAI) during and after the 2020 shutdown, the weight of the CFNAI has been lowered relative to the other indicators.
Finally, every indicator plotted on the BaR is by itself a useful indicator. But, no one indicator (or a few indicators) is superior to the sum of all indicators, which is shown by the mean of coordinates (MoC).
|
| Q: Wouldn’t it be better to plot the BaR with fewer economic indicators? |
A: The strength of the BaR is that it uses an array of indicators that represent all aspects of the economy, providing an accurate portrayal of recent economic activity and sentiment. All 18 indicators correlate well with the business cycle and have a history of declining prior to recessions. When the majority of the indicators move in one direction, it is a sure sign of changing economic conditions.
|
| Q: Often economic data is revised a month or two after it is released. Doesn't this affect how the BaR Analysis Grid reads from month to month? |
A: Only six of the 18 economic indicators that are plotted on the BaR are subject to major revisions. Generally, not more than one or two see significant revisions during the same month. The key measure of the BaR is the MoC, which is the average of all plotted indicators. Even if several measures are revised in the following month, because the MoC is an average of all 18 indicators, its statistical change is generally not very significant.
|
| Q: What are the leading indicators that are tracked on the BaR and why are they tracked? |
A: There are nine leading indicators tracked on the BaR. These leading indicators were selected based on research that demonstrated these measures show emerging trends sooner than other data. The indicators include: consumer sentiment, private building permits, total vehicle sales, small business optimism, temporary employment, weekly unemployment claims, St. Louis Fed Financial Stress Index, OECD business confidence, and yield curve spread (10-yr minus 2-year).
|
| Q: Are the months shown on the grids and charts the months in which the economic activity occurred or the months in which the activity was reported? |
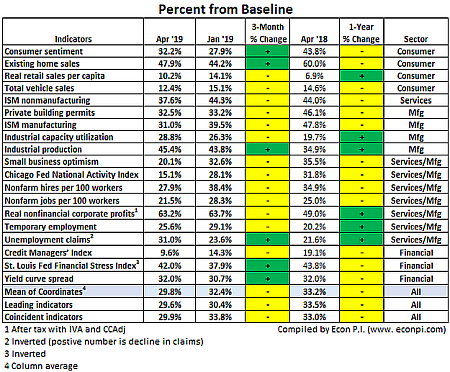
A: The BaR grids and Percent from Baseline tables show the month in which data updates are published by their sources. This better serves the purpose of the BaR and Percent from Baseline, which is to show the current condition of the economy as published data are available. For nearly all data sources, activity from one month is reported during the following month.
The business cycle grids display historical information. Consequently, the periods shown on the business cycle grids are when the economic activity occurred.
|